How-To: Set up Fluentd, Elastic search and Kibana in Kubernetes
Categories:
Prerequisites
Install Elastic search and Kibana
Create a Kubernetes namespace for monitoring tools
kubectl create namespace radius-monitoringAdd the helm repo for Elastic Search
helm repo add elastic https://helm.elastic.co
helm repo update
Install Elastic Search using Helm
By default, the chart creates three replicas which must be on different nodes. If your cluster has fewer than 3 nodes, specify a smaller number of replicas with the
--set replicas=1flag:helm install elasticsearch elastic/elasticsearch --version 7.17.3 -n radius-monitoring --set replicas=1If you are using minikube or simply want to disable persistent volumes for development purposes, you can do so with
--set persistence.enabled=false:helm install elasticsearch elastic/elasticsearch --version 7.17.3 -n radius-monitoring --set persistence.enabled=false,replicas=1Install Kibana
helm install kibana elastic/kibana --version 7.17.3 -n radius-monitoringEnsure that Elastic Search and Kibana are running in your Kubernetes cluster
kubectl get pods -n radius-monitoringYou should see:
NAME                            READY   STATUS    RESTARTS   AGE
elasticsearch-master-0          1/1     Running   0          6m58s
kibana-kibana-95bc54b89-zqdrk   1/1     Running   0          4m21s
Install Fluentd
Install config map and Fluentd as a daemonset
Download these config files:
Note: If you already have Fluentd running in your cluster, enable the nested json parser so that it can parse JSON-formatted logs from radius.
Apply the configurations to your cluster:
kubectl apply -f ./fluentd-config-map.yaml
kubectl apply -f ./fluentd-radius-with-rbac.yaml
Ensure that Fluentd is running as a daemonset. The number of Fluentd instances should be the same as the number of cluster nodes. In the example below, there is only one node in the cluster:
kubectl get pods -n kube-system -wYou should see:
NAME                          READY   STATUS    RESTARTS   AGE
coredns-6955765f44-cxjxk      1/1     Running   0          4m41s
coredns-6955765f44-jlskv      1/1     Running   0          4m41s
etcd-m01                      1/1     Running   0          4m48s
fluentd-sdrld                 1/1     Running   0          14s
Install Radius control plane
Visit the Kubernetes docs to learn how to install the Radius control plane. By default, Radius has JSON logging enabled.
For Kubernetes, you can install with the rad CLI:
rad install kubernetes
Search logs
Once the Radius control plane is installed, you can search the logs using Kibana.
Note: There is a small delay for Elastic Search to index the logs that Fluentd sends. You may need to wait a minute and refresh to see your logs.
Port-forward from localhost to
svc/kibana-kibanakubectl port-forward svc/kibana-kibana 5601 -n radius-monitoringYou should see:
Forwarding from 127.0.0.1:5601 -> 5601
Forwarding from [::1]:5601 -> 5601
Handling connection for 5601
Handling connection for 5601
Browse to
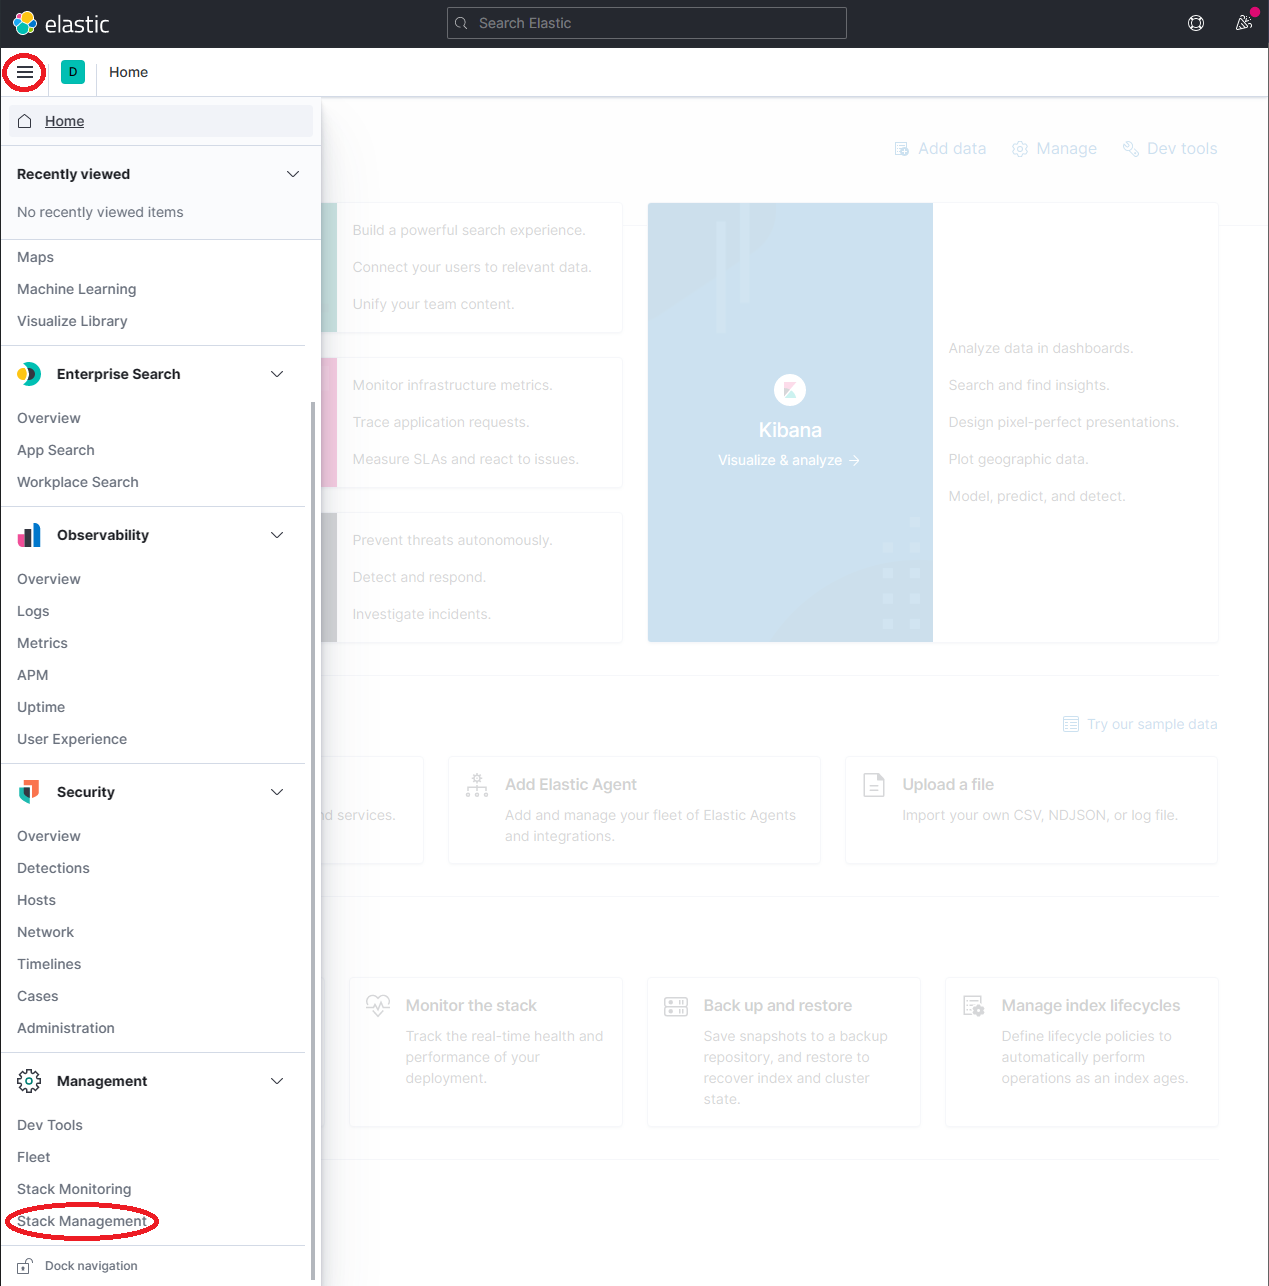
http://localhost:5601Expand the drop-down menu and click Management → Stack Management
On the Stack Management page, select Data → Index Management and wait until
radius-*is indexed.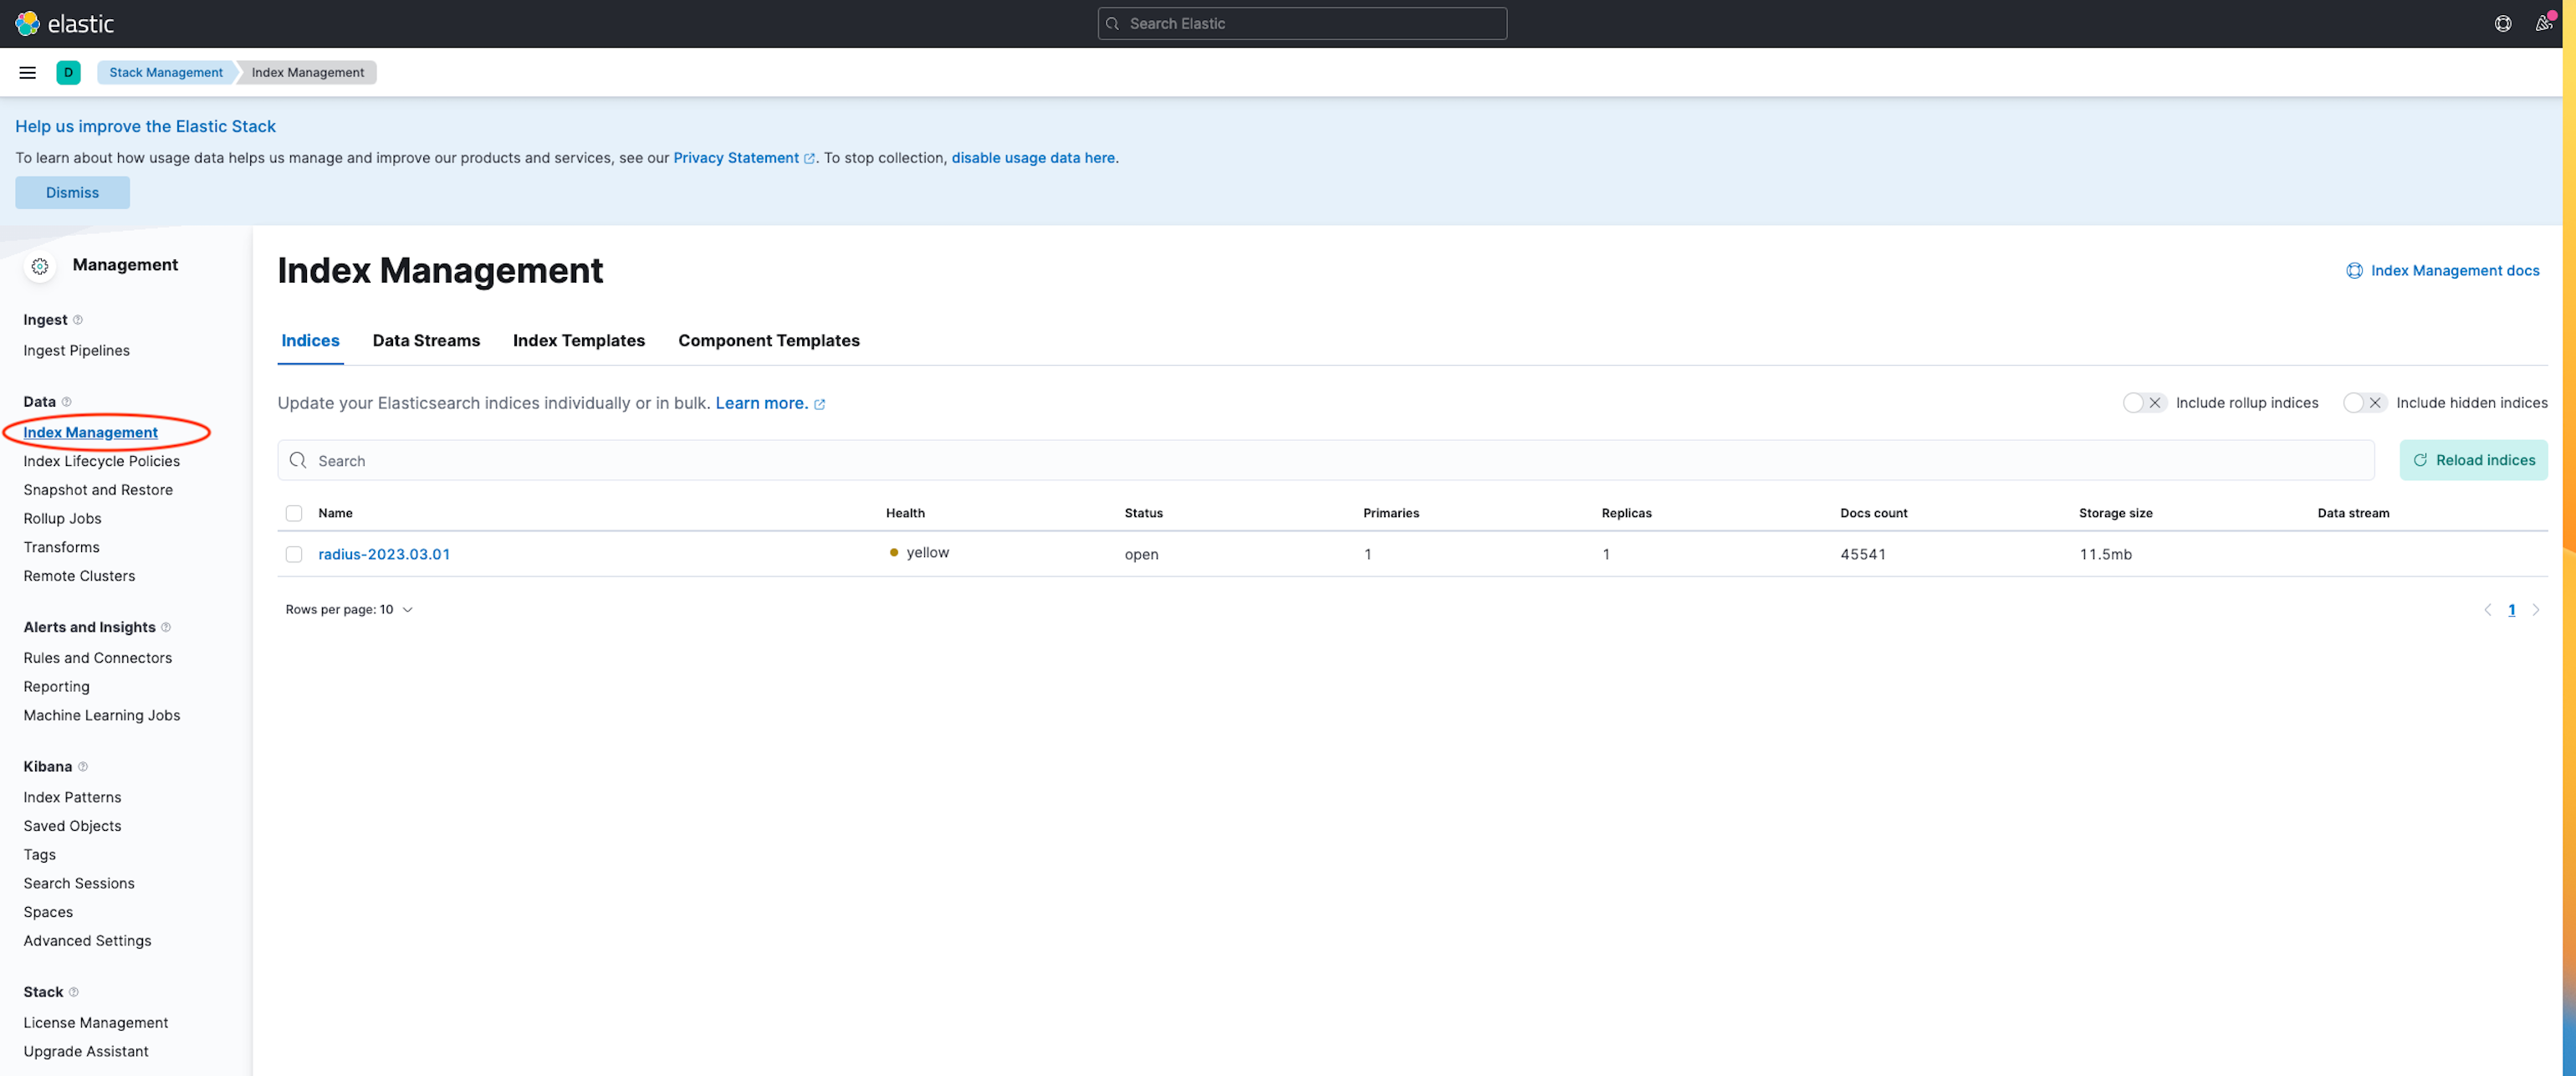
Once
radius-*is indexed, click on Kibana → Index Patterns and then the Create index pattern button.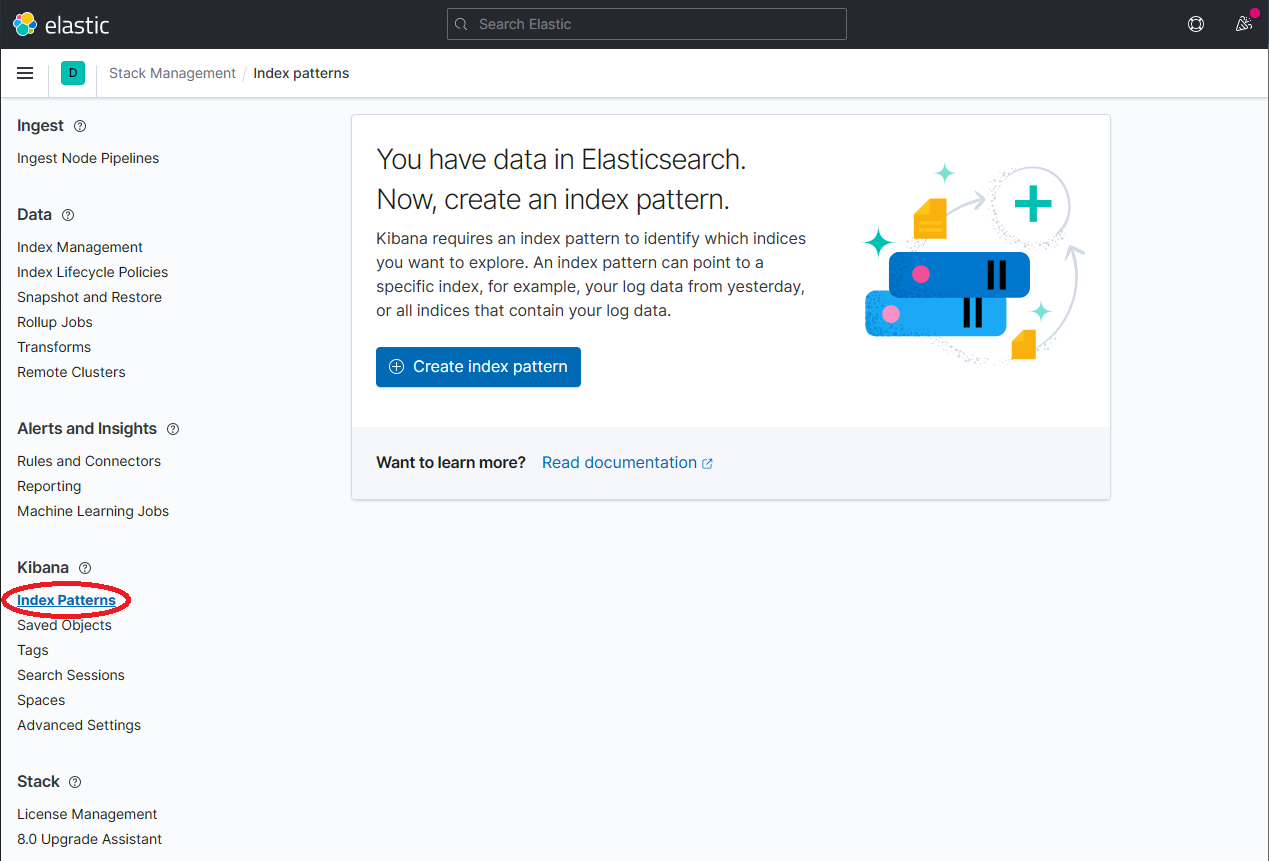
Define a new index pattern by typing
radius*into the Index Pattern name field, then click the Next step button to continue.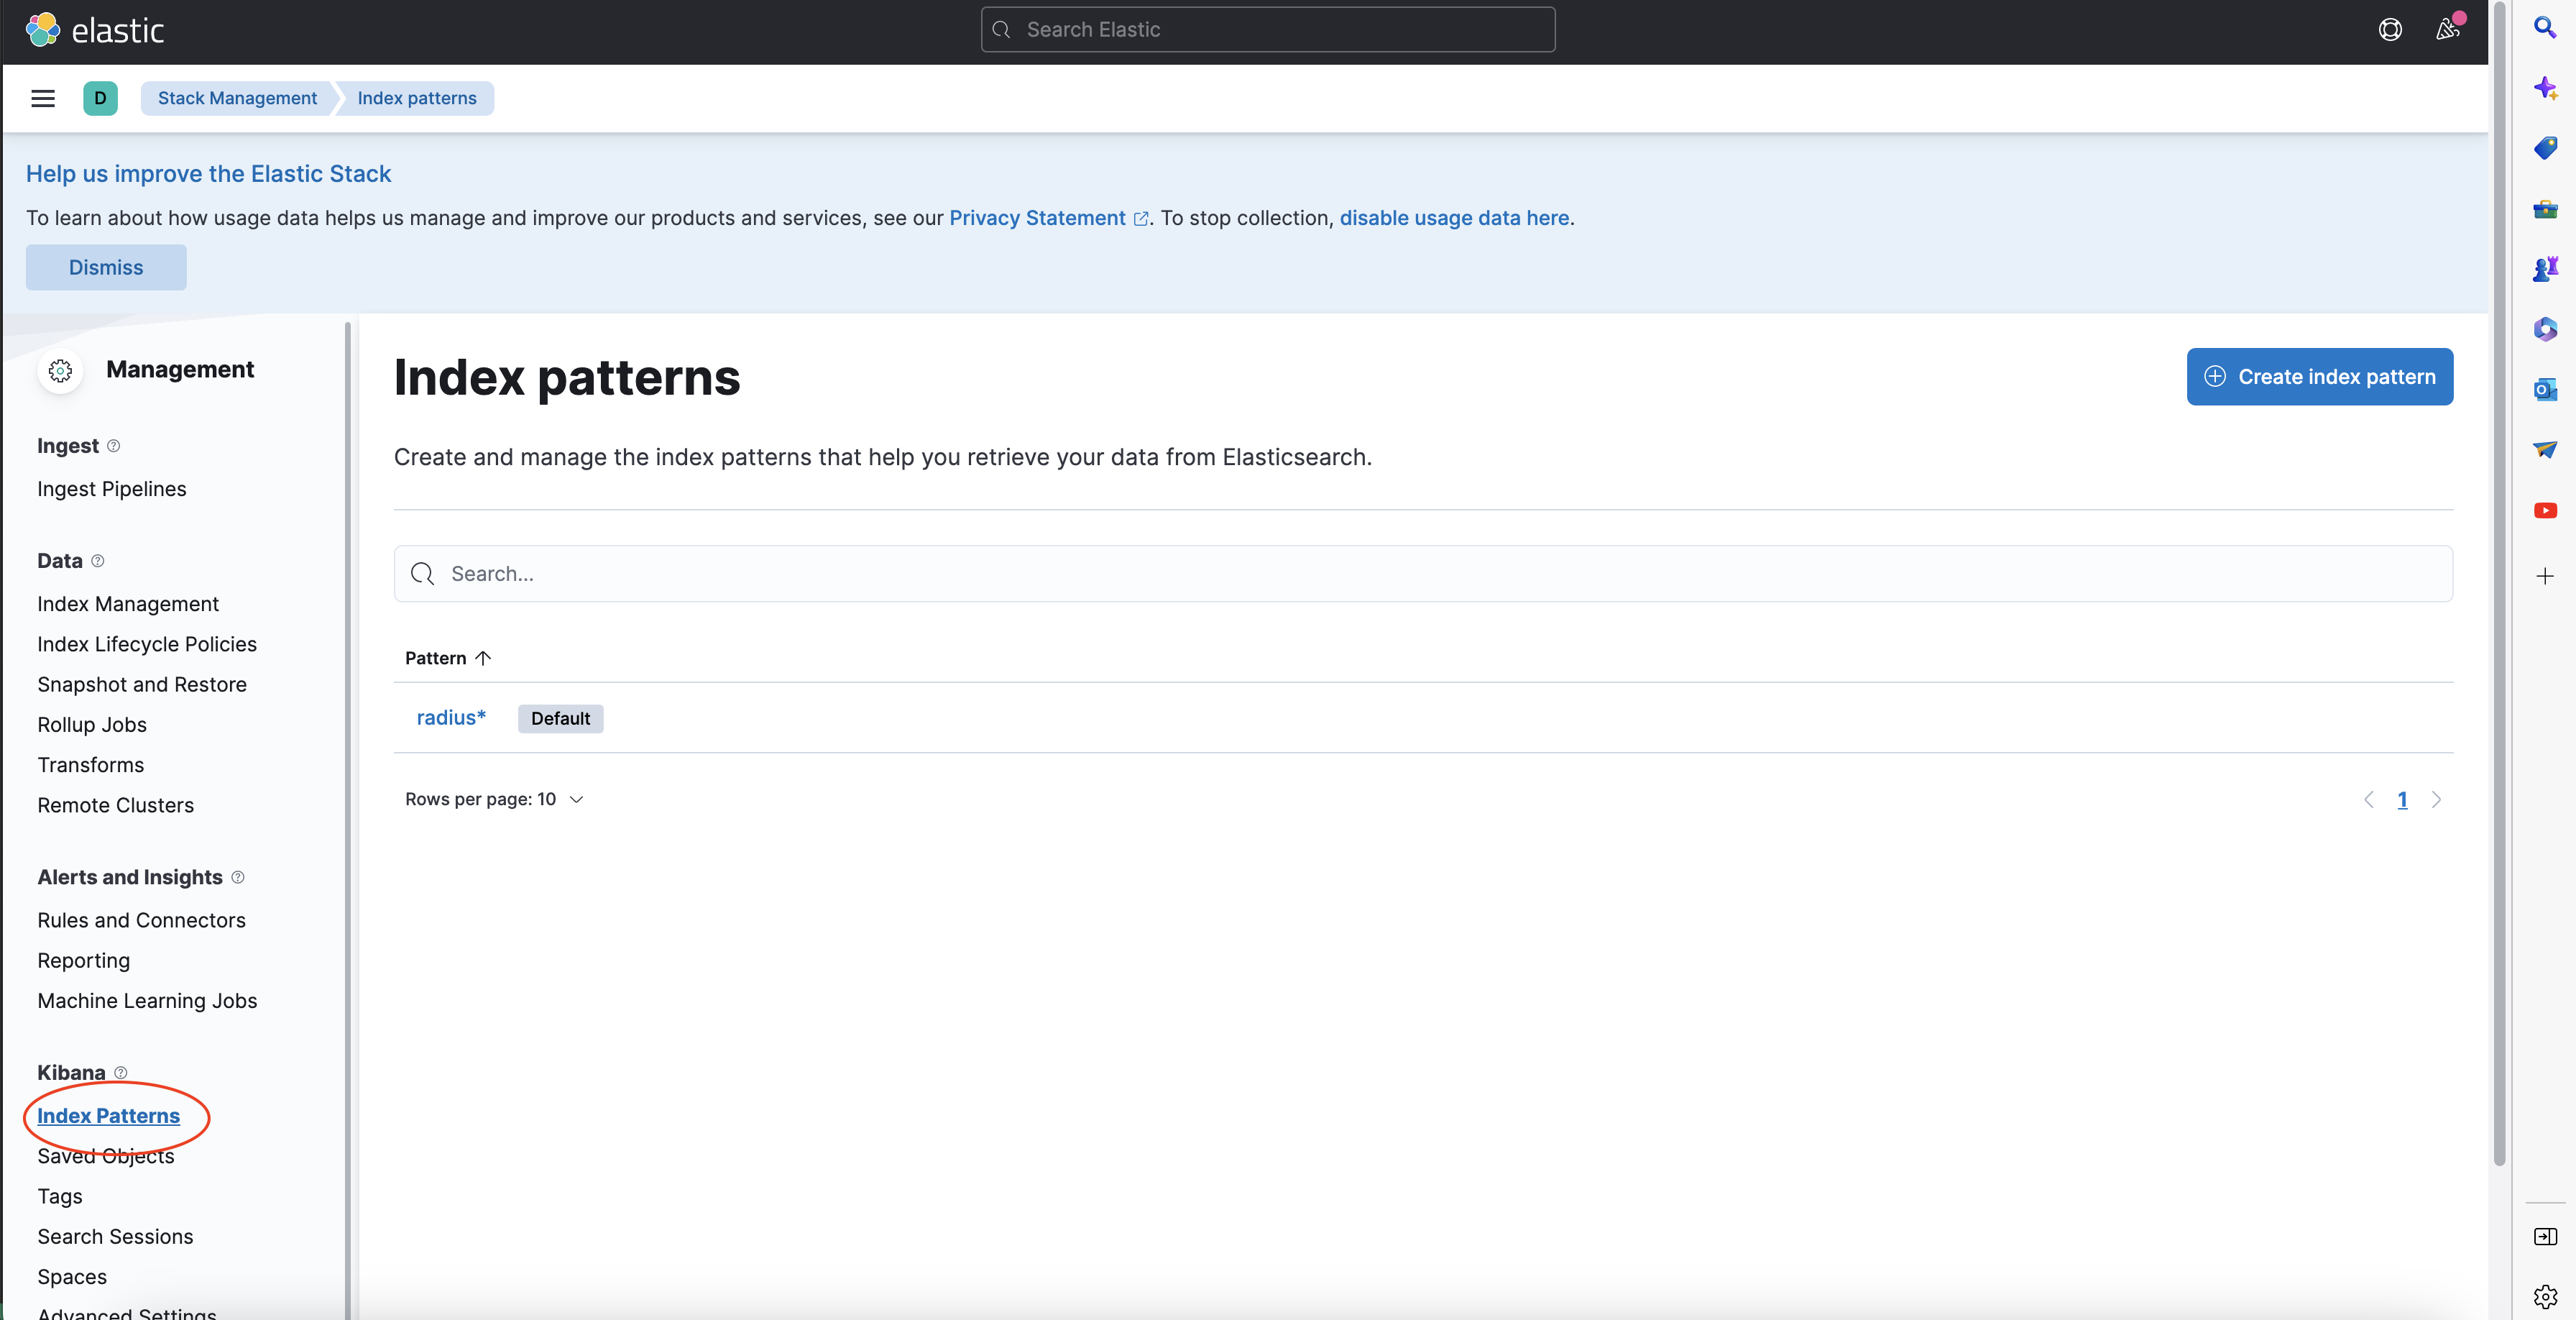
Configure the primary time field to use with the new index pattern by selecting the
@timestampoption from the Time field drop-down. Click the Create index pattern button to complete creation of the index pattern.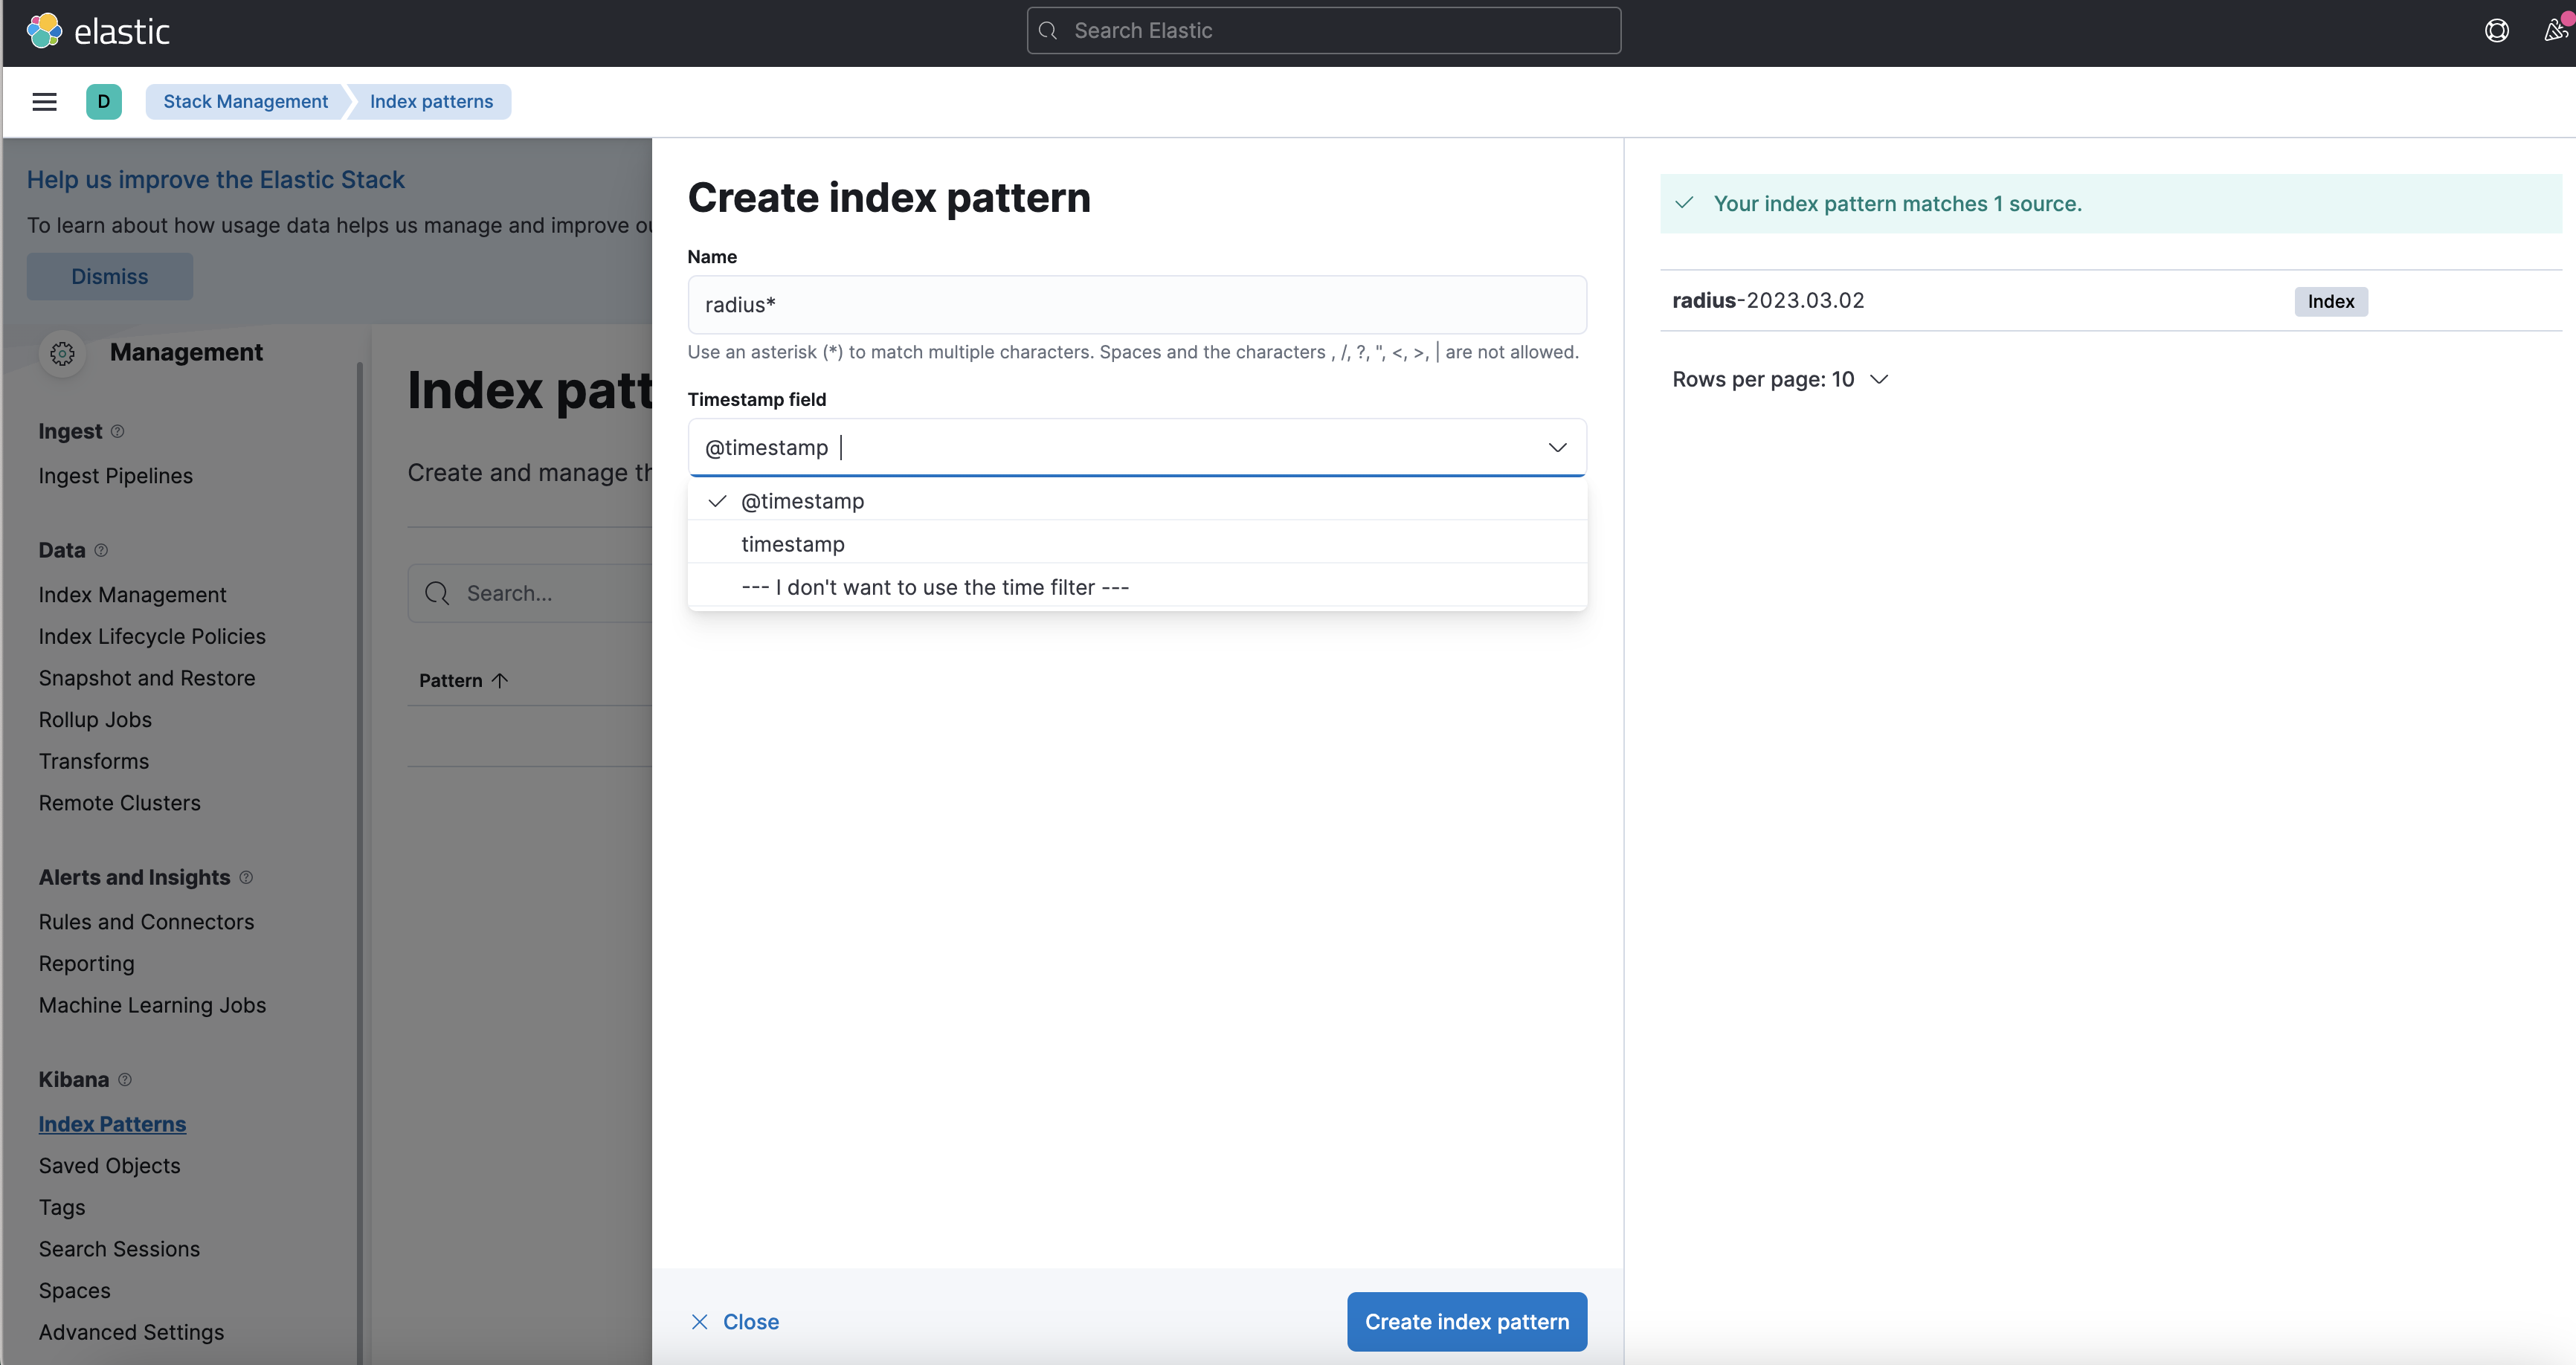
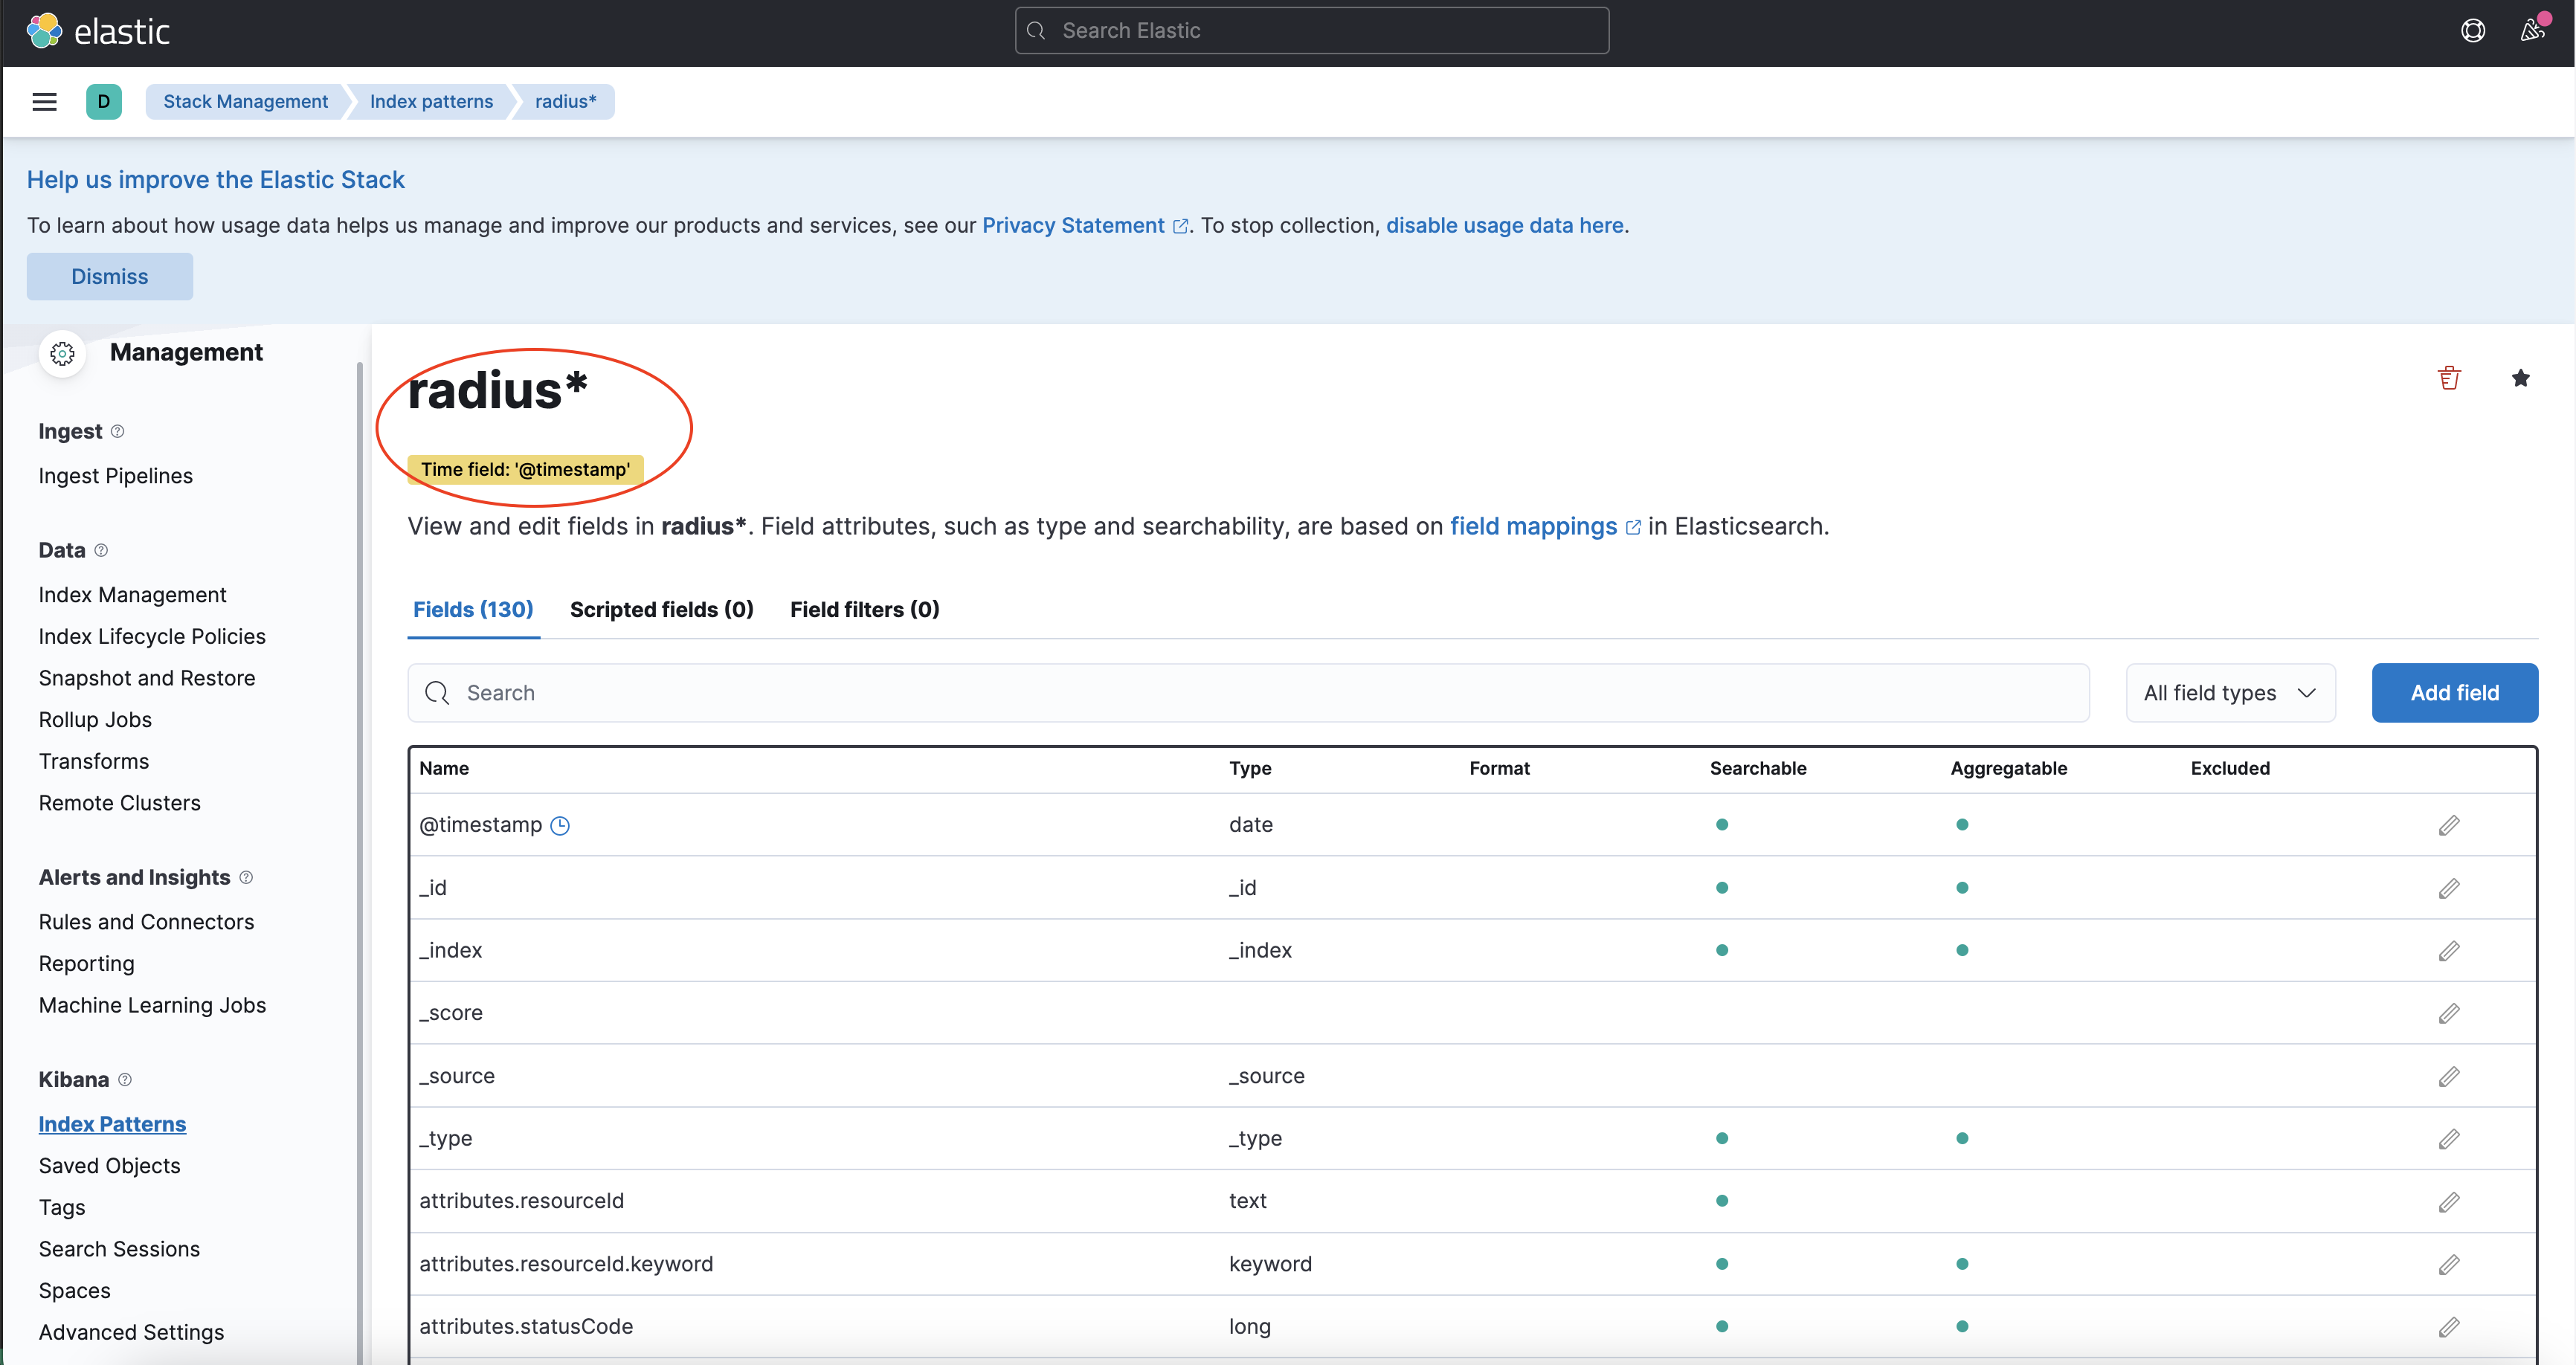
The newly created index pattern should be shown. Confirm that the fields of interest such as
scope,type,app_id,level, etc. are being indexed by using the search box in the Fields tab.Note: If you cannot find the indexed field, please wait. The time it takes to search across all indexed fields depends on the volume of data and size of the resource that the elastic search is running on.
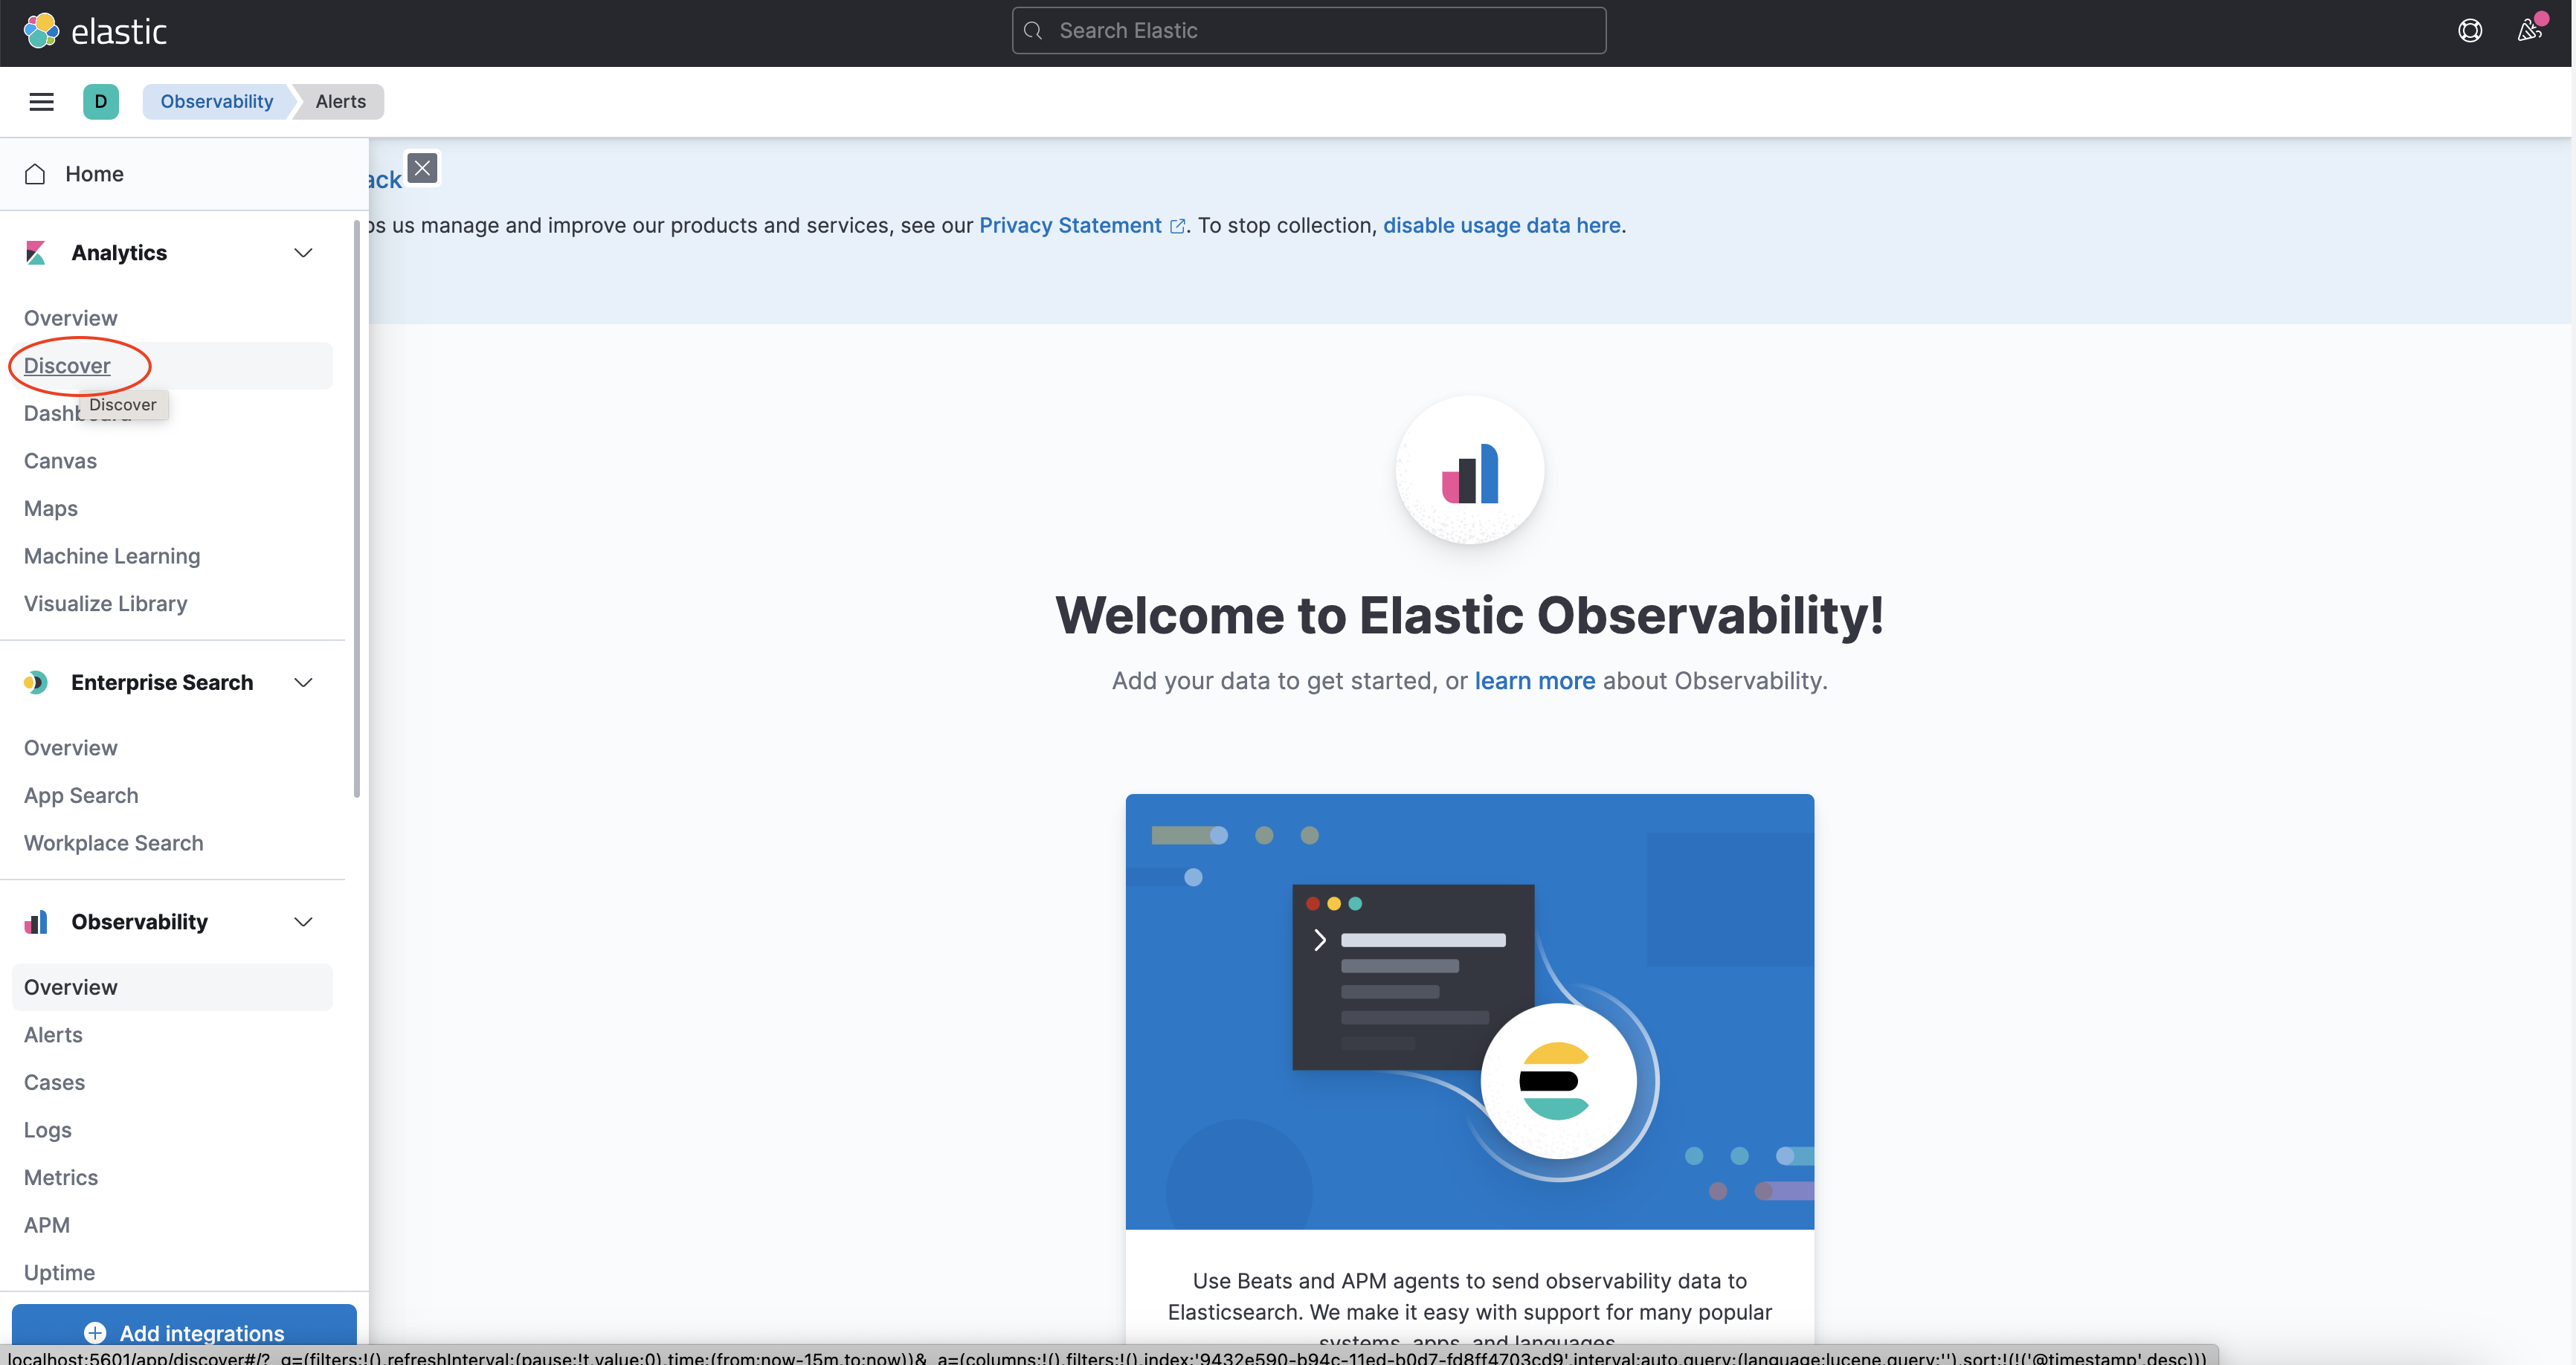
To explore the indexed data, expand the drop-down menu and click Analytics → Discover.
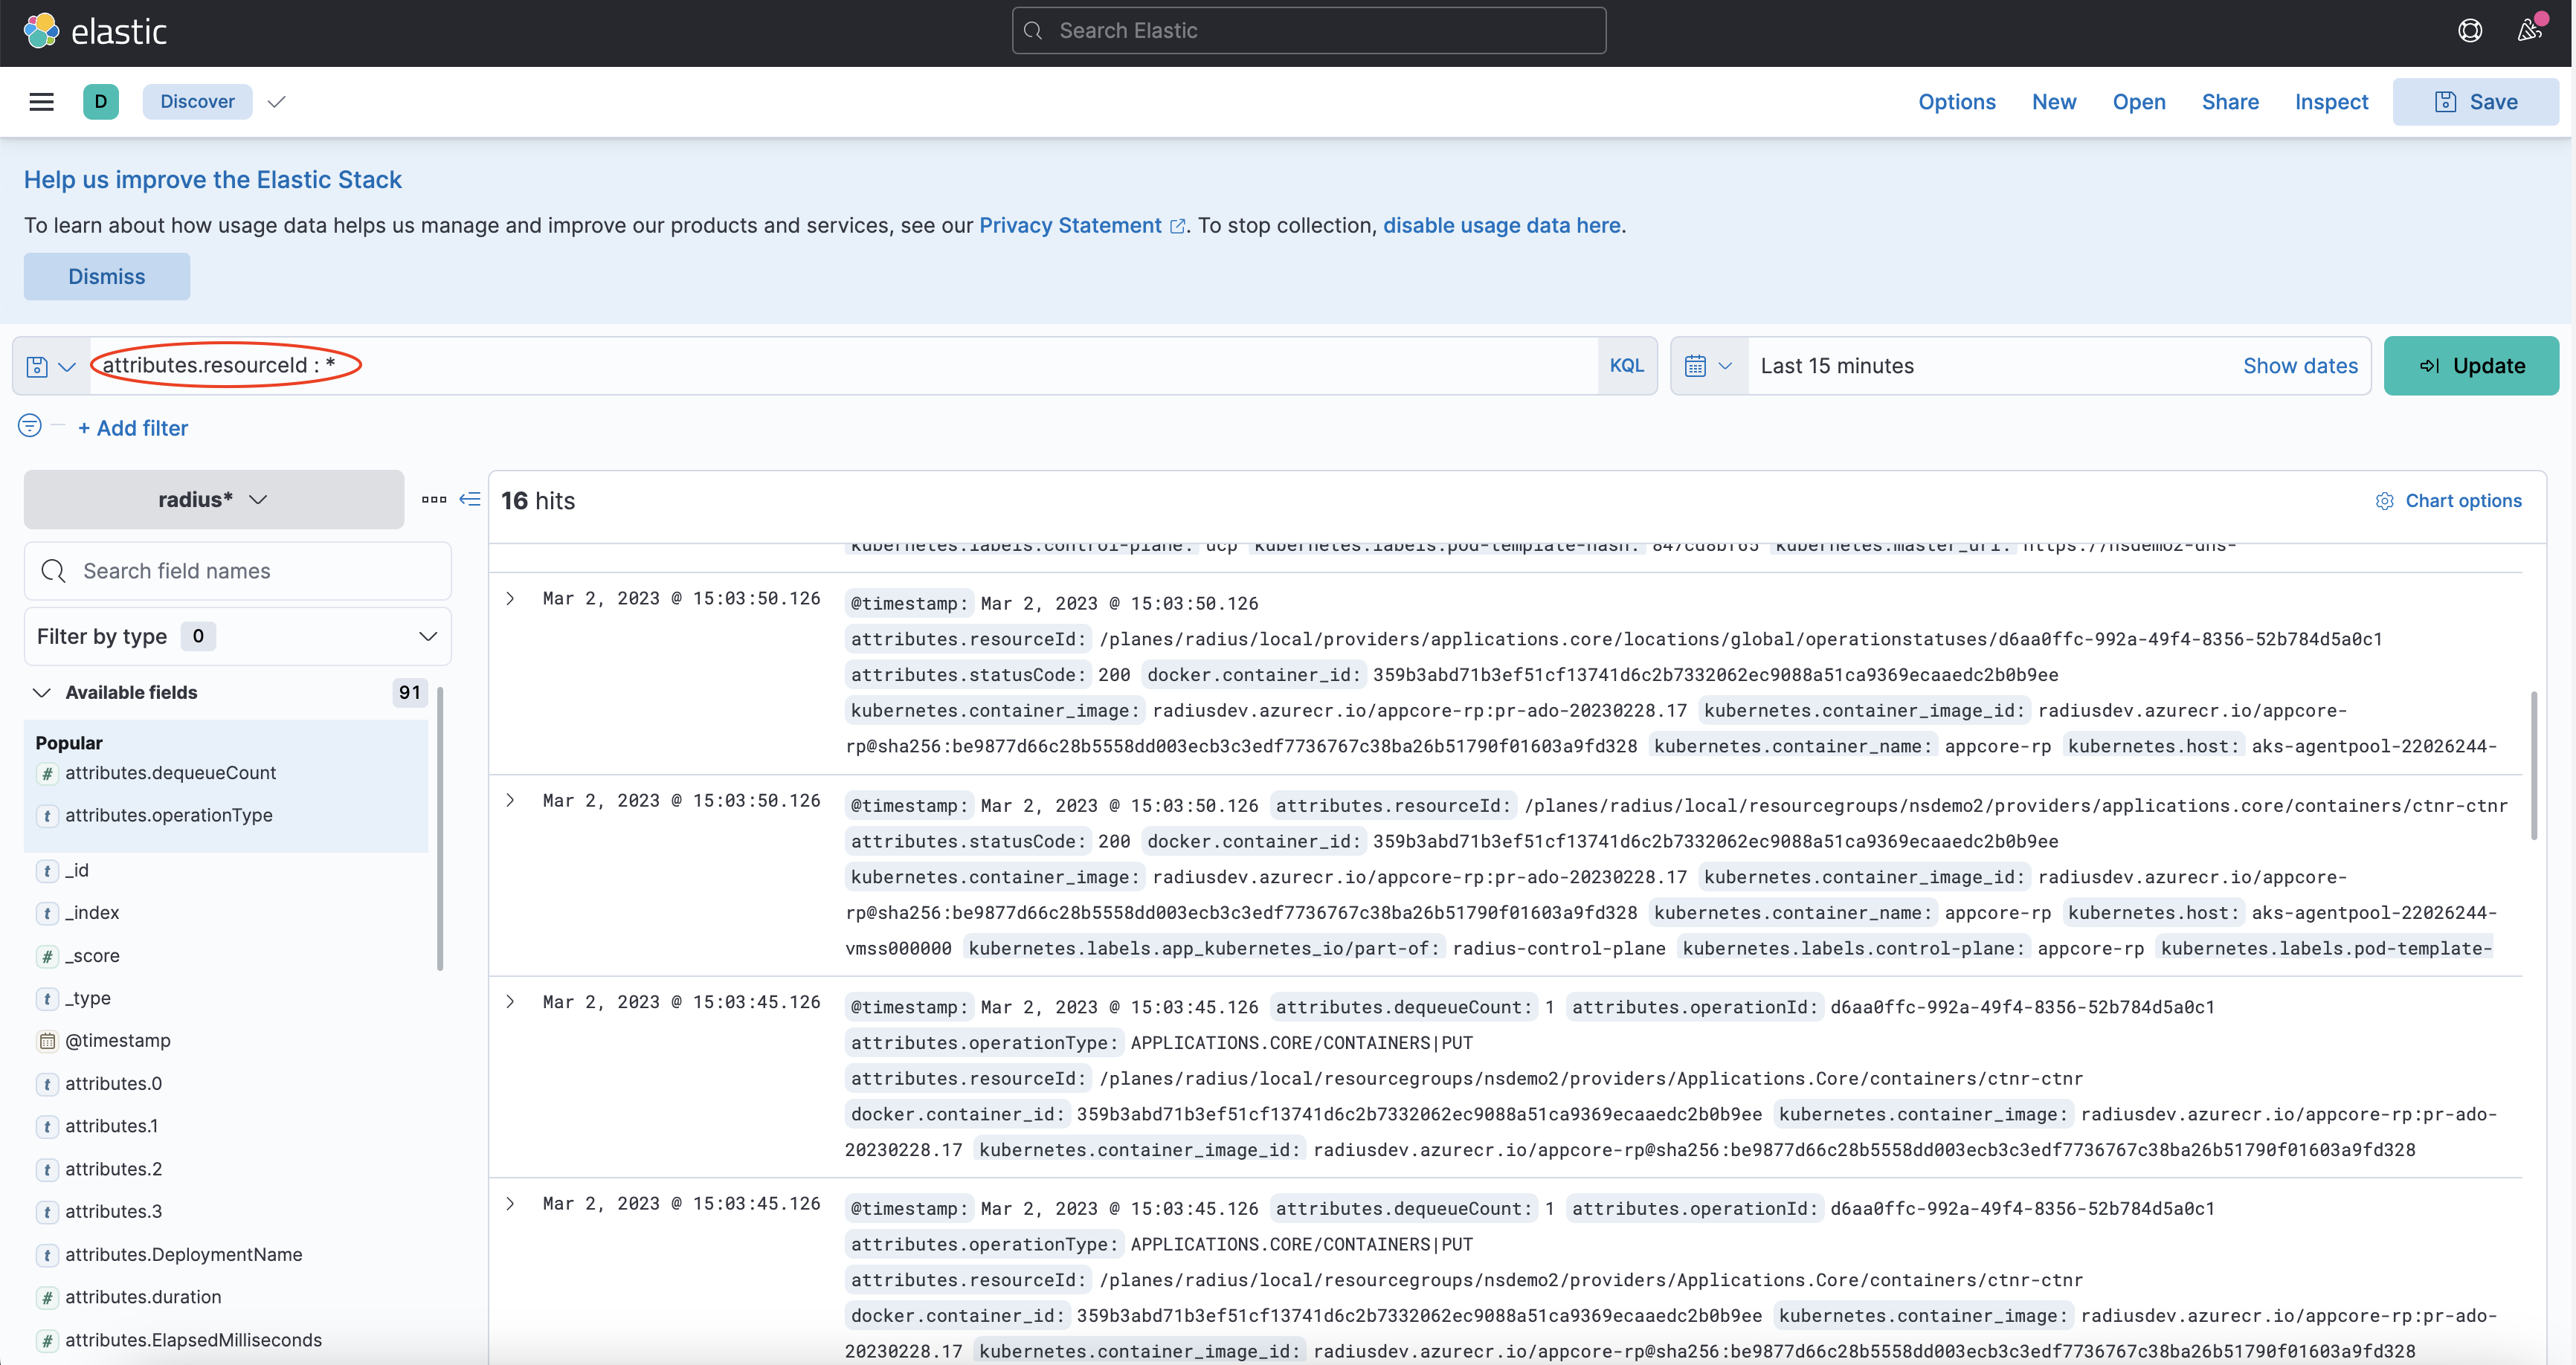
In the search box, type in a query string such as
scope:*and click the Refresh button to view the results.Note: This can take a long time. The time it takes to return all results depends on the volume of data and size of the resource that the elastic search is running on.
References
Feedback
Was this page helpful?
Glad to hear it! Please feel free to star our repo and join our Discord server to stay up to date with the project.
Sorry to hear that. If you would like to also contribute a suggestion visit and tell us how we can improve.