How-To: Observe metrics with Grafana
Categories:
Grafana is an open-source visualization and analytics tool that allows you to query, visualize, alert on, and explore your metrics. This guide will show you how to install Grafana and configure it to visualize the Radius control plane metrics from Prometheus.
Example dashboards
There are two example dashboards that you can import into Grafana to quickly get started visualizing your metrics and then customize them to meet your needs.
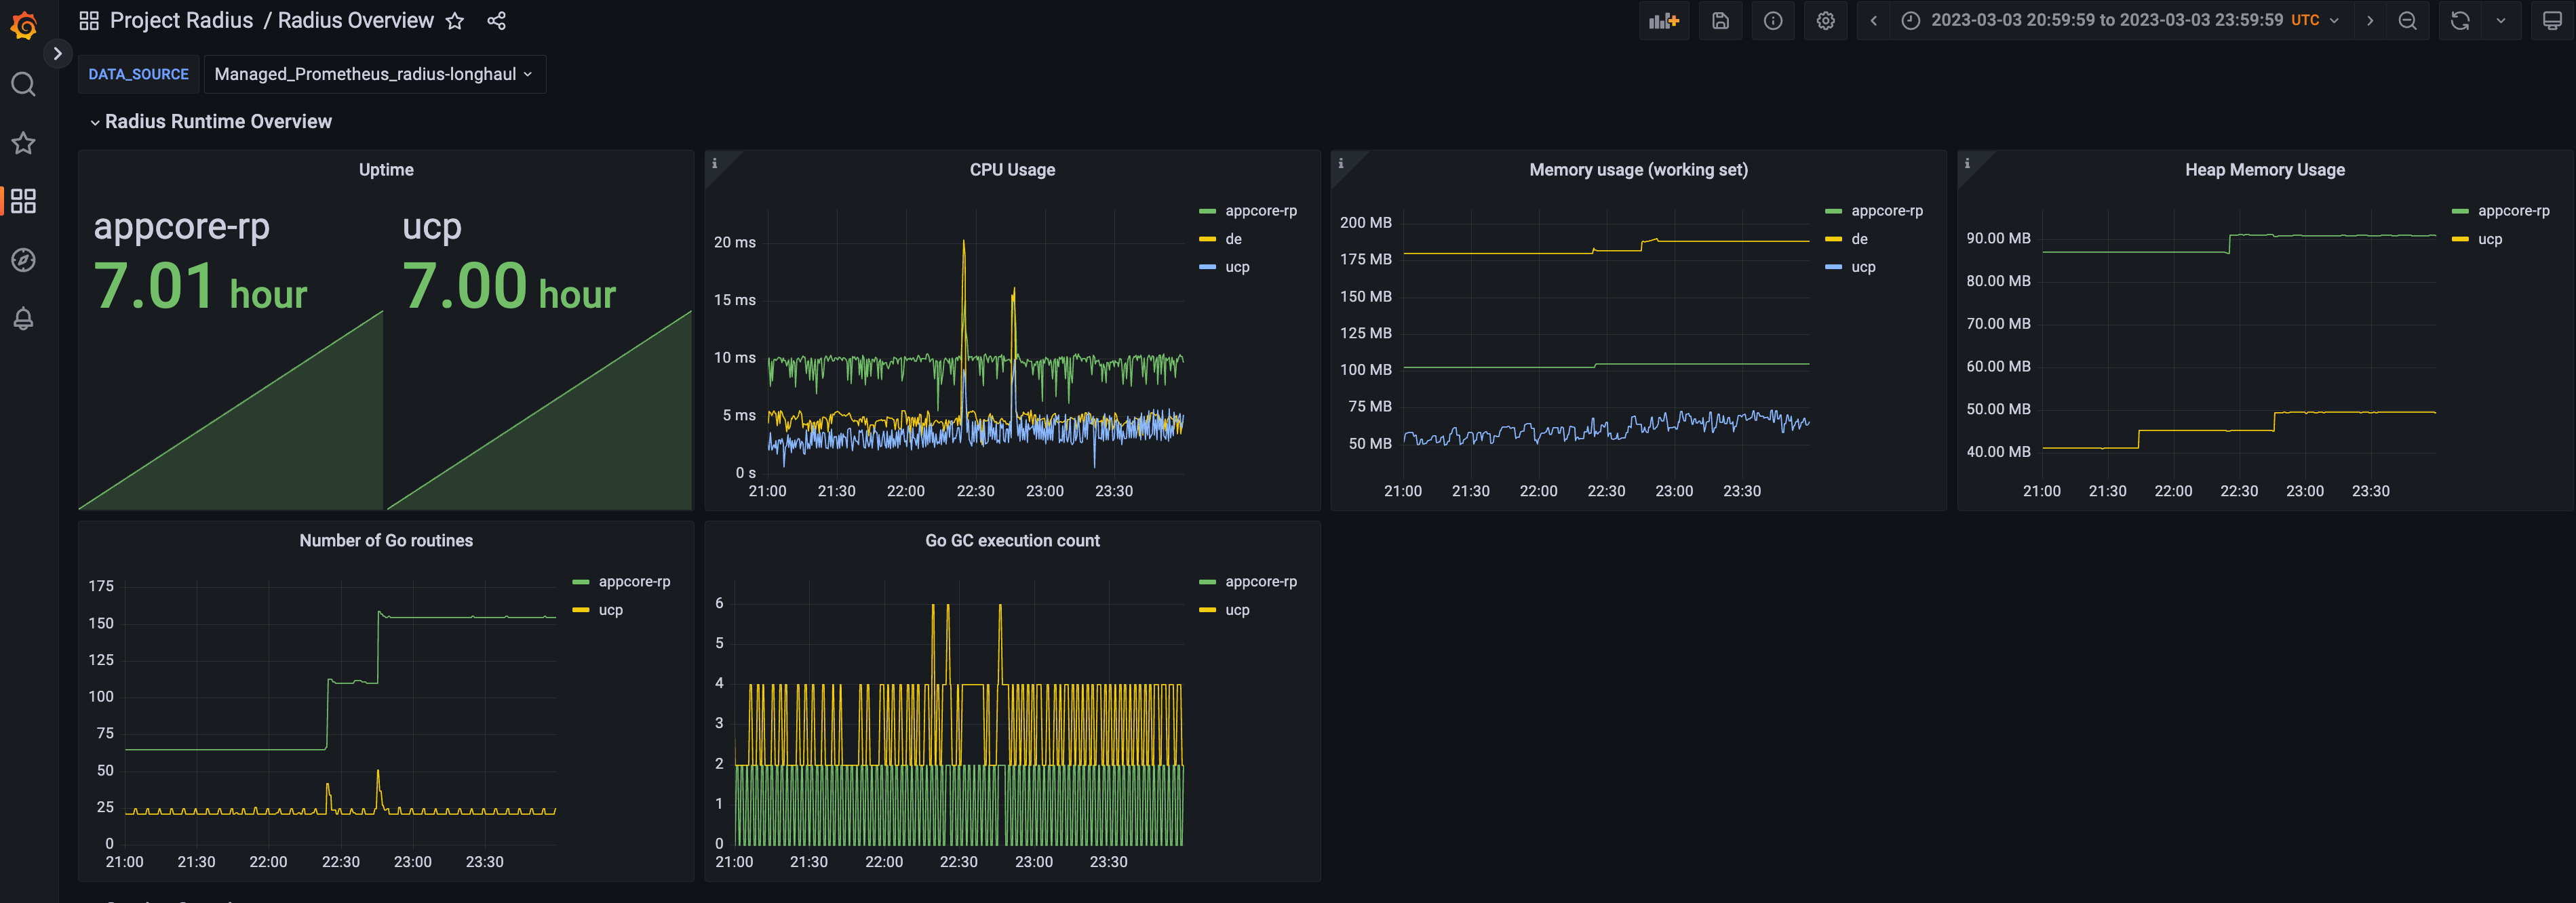
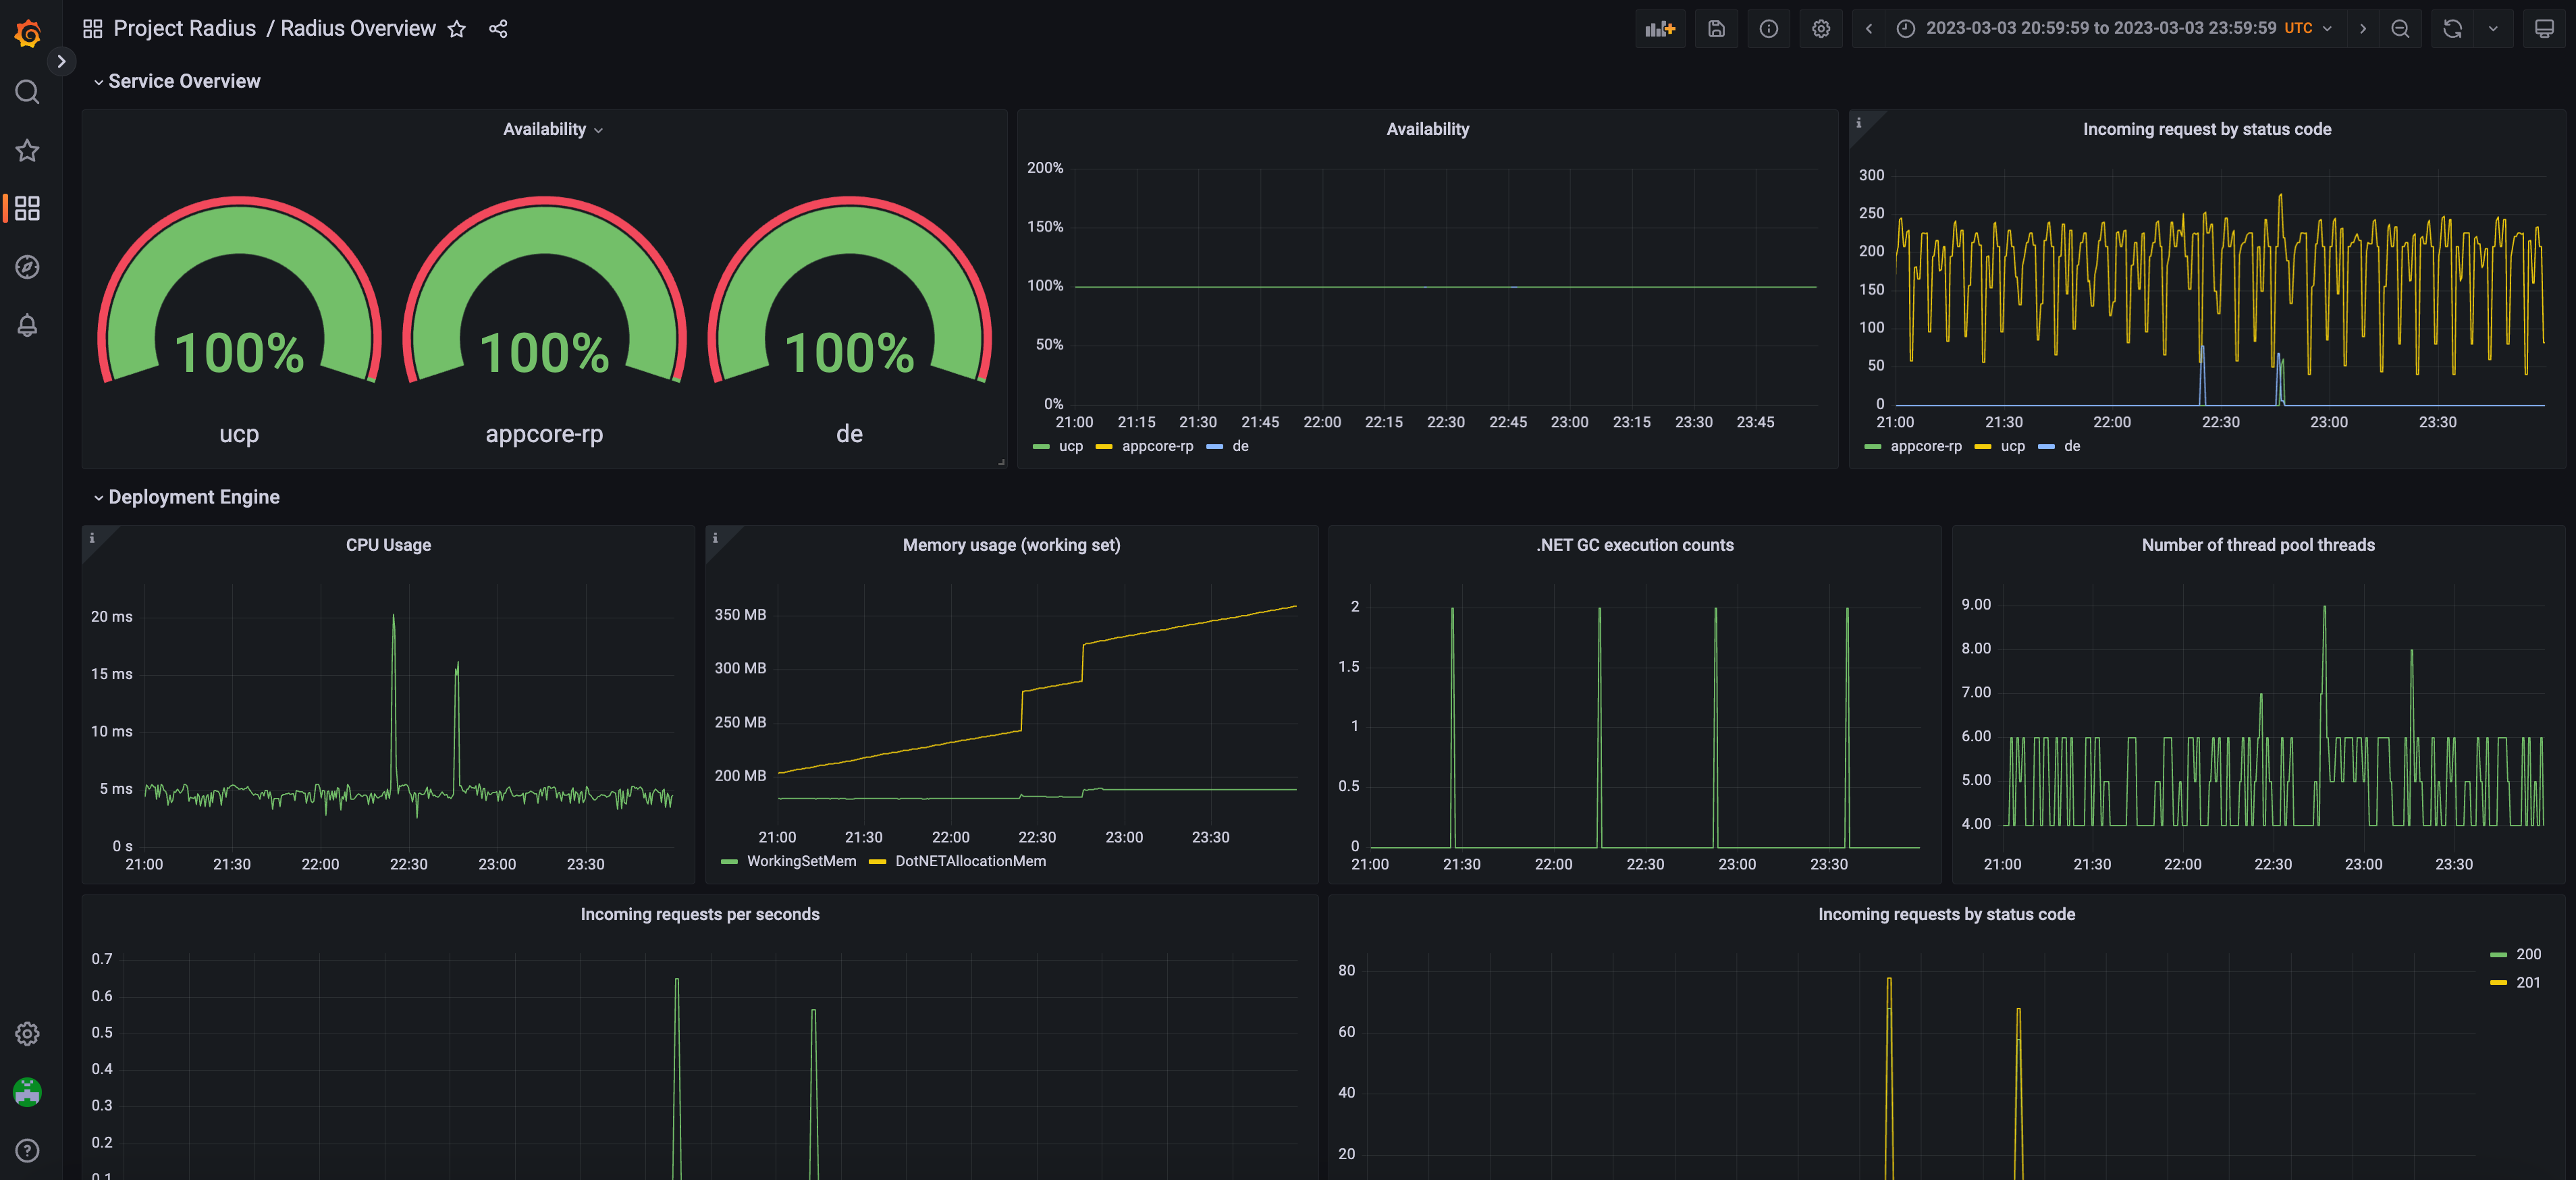
Control plane overview
The radius-overview-dashboard.json template shows Radius and Deployment Engine statuses, including runtime, and server-side health:
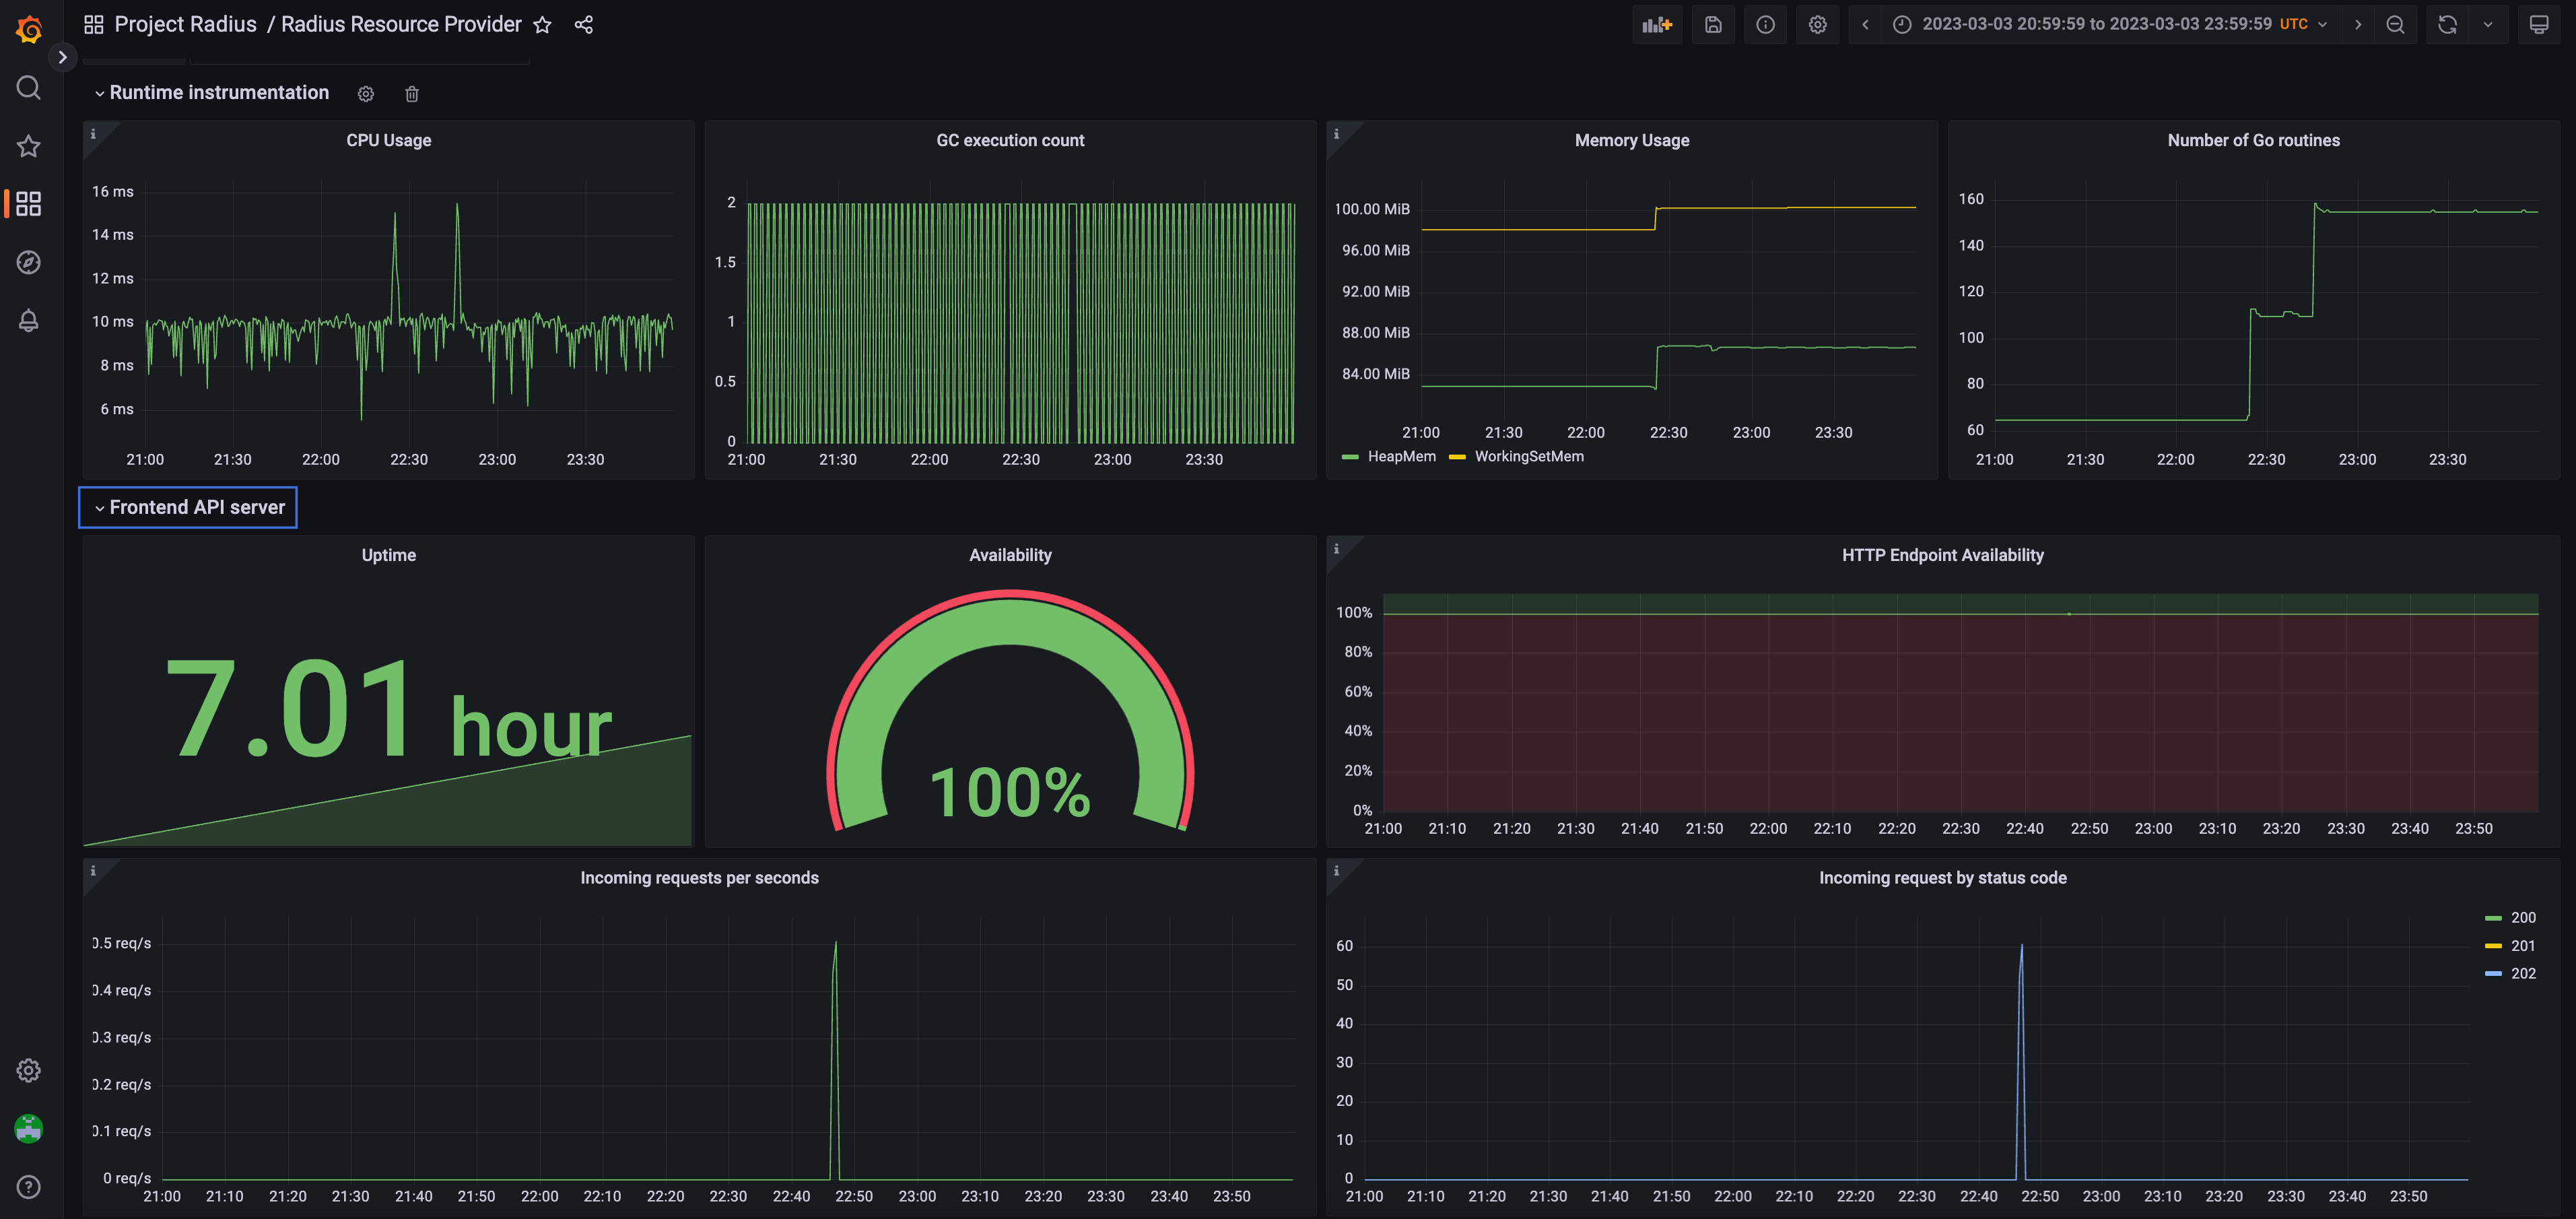
Resource provider overview
The radius-resource-provider-dashboard.json template shows Radius Resource Provider status, including runtime, server-side, and operations health:

Setup on Kubernetes
Pre-requisites
- Setup Prometheus on your Kubernetes cluster
- Helm 3
Install Grafana
Add the Grafana Helm repo:
helm repo add grafana https://grafana.github.io/helm-charts
helm repo update
Install the chart:
helm install grafana grafana/grafana -n radius-monitoringIf you are Minikube user or want to disable persistent volume for development purpose, you can disable it by using the following command instead:
helm install grafana grafana/grafana -n radius-monitoring --set persistence.enabled=falseRetrieve the admin password for Grafana login:
kubectl get secret --namespace radius-monitoring grafana -o jsonpath="{.data.admin-password}" | base64 --decode ; echoYou will get a password similar to
cj3m0OfBNx8SLzUlTx91dEECgzRlYJb60D2evof1%. Remove the%character from the password to getcj3m0OfBNx8SLzUlTx91dEECgzRlYJb60D2evof1as the admin password.Validate that Grafana is running in your cluster:
kubectl get pods -n radius-monitoringYou should see something similar to the following:
NAME                        READY   STATUS       RESTARTS   AGE
grafana-c49889cff-x56vj     1/1     Running      0          5m10s
...
Configure Prometheus as data source
Now that Grafana is installed, you need to configure it to use Prometheus as a data source.
Port-forward to your Grafana service:
kubectl port-forward svc/grafana 8080:80 -n radius-monitoringOpen a browser to
http://localhost:8080Login to Grafana
- Username:
admin - Password: Password from above
- Username:
Select
ConfigurationandData SourcesAdd Prometheus as a data source.
Get your Prometheus HTTP URL:
The Prometheus HTTP URL follows the format
http://<prometheus service endpoint>.<namespace>Start by getting the Prometheus server endpoint by running the following command:
kubectl get svc -n radius-monitoringYou should see something similar to the following:
NAME                                     TYPE        CLUSTER-IP        EXTERNAL-IP   PORT(S)             AGE
radius-prom-kube-state-metrics           ClusterIP   10.0.174.177      <none>        8080/TCP            7d9h
radius-prom-prometheus-alertmanager      ClusterIP   10.0.255.199      <none>        80/TCP              7d9h
radius-prom-prometheus-node-exporter     ClusterIP   None              <none>        9100/TCP            7d9h
radius-prom-prometheus-pushgateway       ClusterIP   10.0.190.59       <none>        9091/TCP            7d9h
radius-prom-prometheus-server            ClusterIP   10.0.172.191      <none>        80/TCP              7d9h
grafana                                  ClusterIP   10.0.15.229       <none>        80/TCP              5d5h
In this example the server name is
radius-prom-prometheus-serverand the namespace isradius-monitoring, so the HTTP URL will behttp://radius-prom-prometheus-server.radius-monitoring.Fill in the following settings:
- Name:
Radius - HTTP URL:
http://radius-prom-prometheus-server.radius-monitoring - Default: On
- Name:
Click
Save & Testbutton to verify that the connection succeeded.
Import dashboards in Grafana
- Download the Grafana dashboard templates:
- In the upper left corner of the Grafana home screen, click the “+” option, then “Import”, and select your templates.
- Select the dashboard that you imported and enjoy!
References
Feedback
Was this page helpful?
Glad to hear it! Please feel free to star our repo and join our Discord server to stay up to date with the project.
Sorry to hear that. If you would like to also contribute a suggestion visit and tell us how we can improve.