How-To: Set up Jaeger for distributed tracing
Categories:
Jaeger is an open-source distributed tracing system. It helps gather timing data needed to troubleshoot latency problems in microservice architectures. It manages both the collection and lookup of this data.
The following steps show you how to configure the Radius control plane to send distributed tracing data to Jaeger running as a container in your Kubernetes cluster and how to view the data.
Pre-requisites
Step 1: Install Jaeger on Kubernetes
Create the namespace
radius-monitoring:kubectl create namespace radius-monitoringCreate the file
Download jaeger.yamljaeger.yaml, and paste the following YAML:Install Jaeger:
kubectl apply -f jaeger.yamlWait for Jaeger to be up and running
kubectl wait deploy --selector app=jaeger --for=condition=available -n radius-monitoring
Step 2: Configure Radius control plane
Install the Radius control plane with your Zipkin endpoint set to your Jaeger collector endpoint using
rad install kubernetes:rad install kubernetes --set global.zipkin.url=http://jaeger-collector.radius-monitoring.svc.cluster.local:9411/api/v2/spansNote:
http://jaeger-collector.radius-monitoring.svc.cluster.local:9411/api/v2/spansis the default URL for Jaeger when installed using the above instructions. If you have changed the service name or namespace, use that instead.
Step 3: View Tracing Data
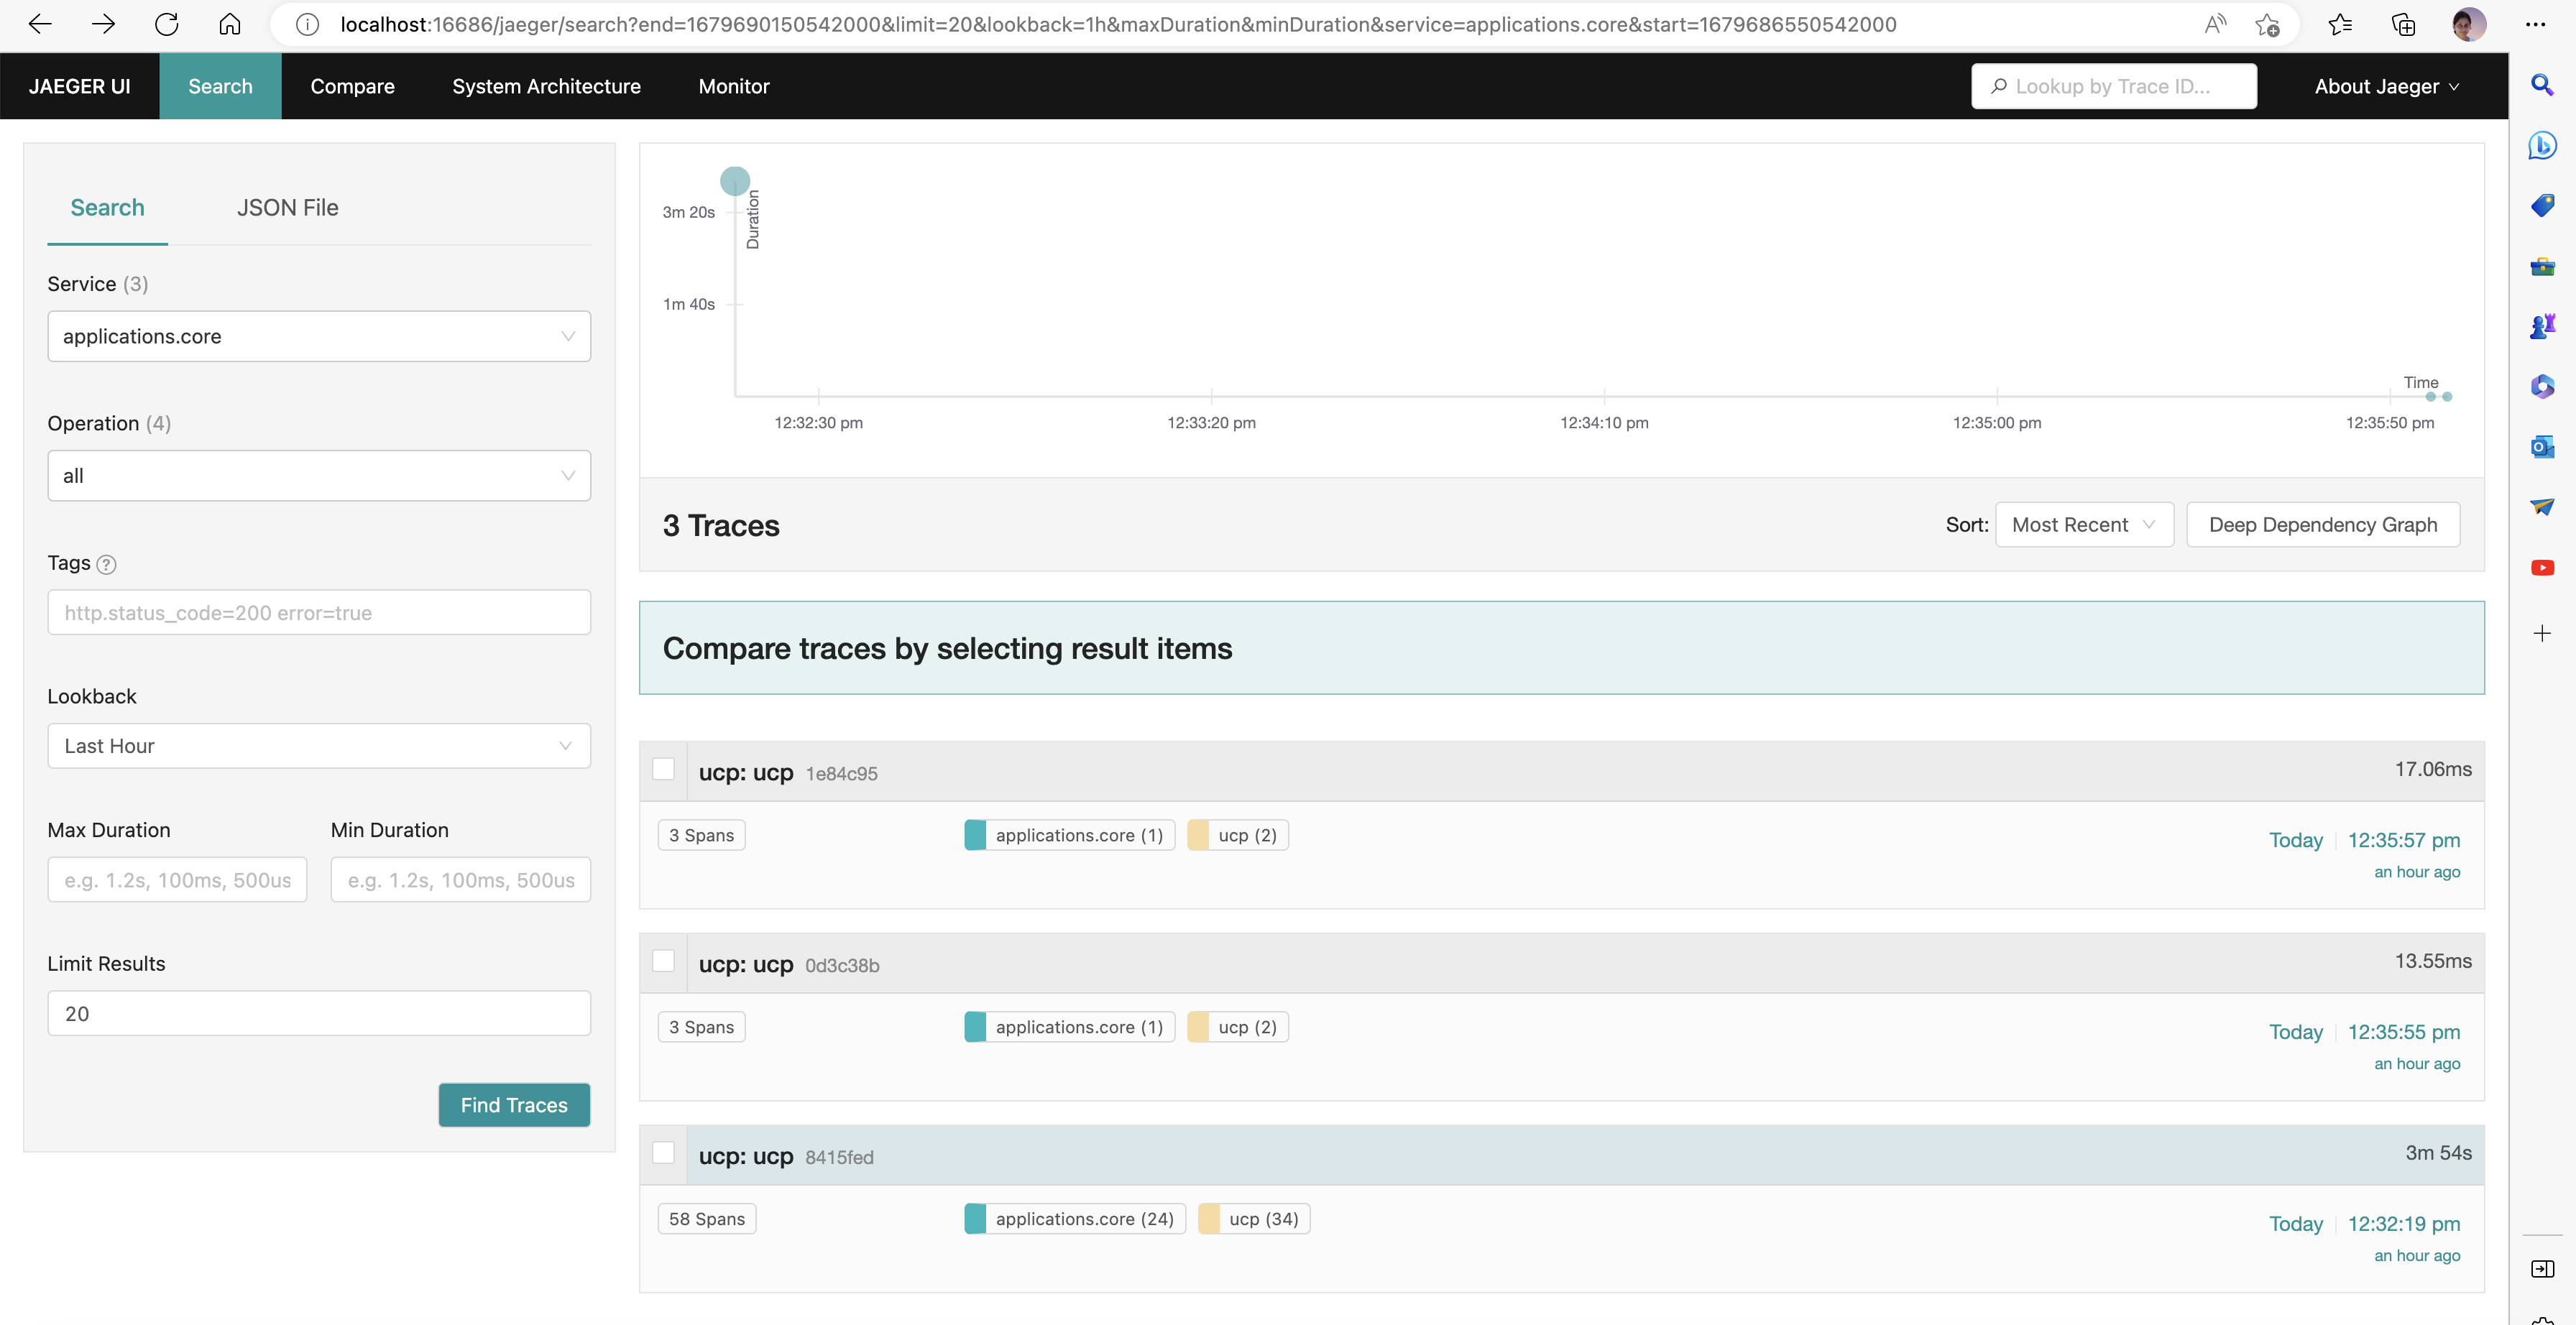
Port forward the Jaeger service to your local machine:
kubectl port-forward svc/tracing 16686 -n radius-monitoringIn your browser, go to http://localhost:16686 to see the Jaeger UI:
References
Feedback
Was this page helpful?
Glad to hear it! Please feel free to star our repo and join our Discord server to stay up to date with the project.
Sorry to hear that. If you would like to also contribute a suggestion visit and tell us how we can improve.